New in ArcGIS Pro 3.3, probabilities in Forest-based and Boosted Classification in the Spatial Statistics toolbox. In addition to providing predicted categories as classification output, these algorithms now provide accompanying probabilities for each of the categories predicted by the model. Probabilities can tell you more about the likelihoods of individual categories, as well as confidence in individual predictions.
Example Demo
The data for this example comes from FEMA’s National Risk Index and the State of California’s historical wildfire records. This example is for illustrative purposes only.
Below is a map of census tracts in California, shaded by whether they historically were subject to at least one wildfire annually.
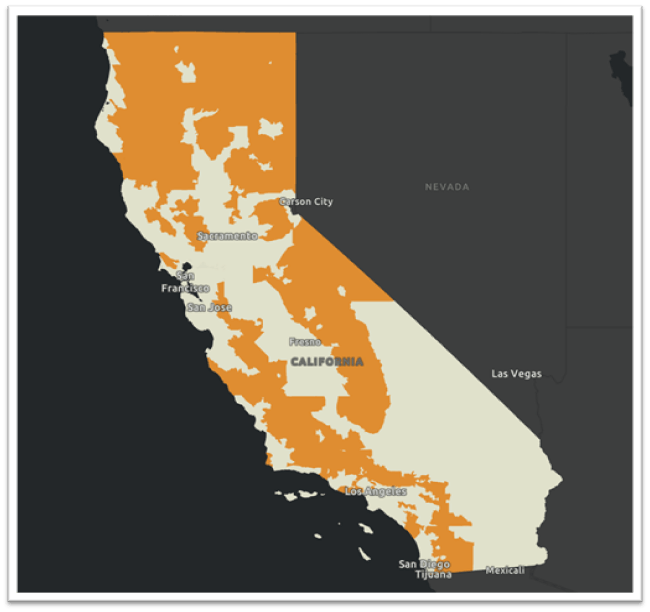
Suppose you want to create a model to predict the risk of experiencing an annual wildfire, using other factors about the census tract. For example: drought frequency, strong wind frequency, lightning frequency, winter storm frequency, and information on agricultural land.
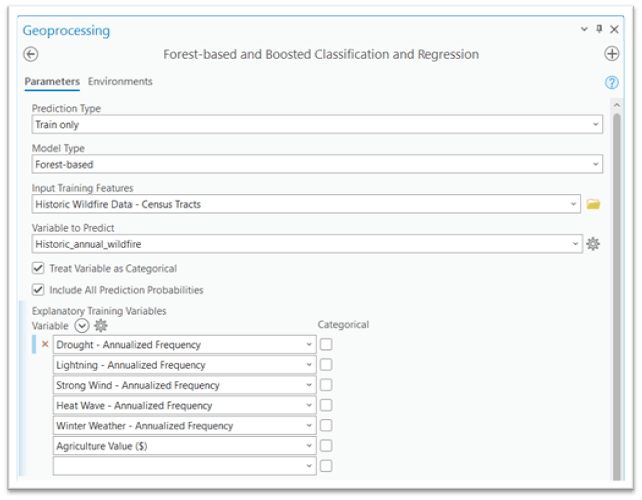
The Forest-based and Boosted Classification and Regression tool is set up below, with the new parameter Include All Prediction Probabilities enabled.
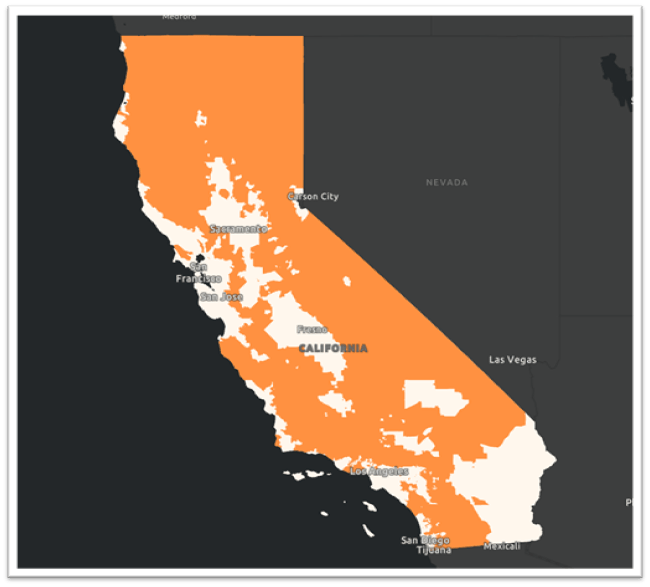
The output predictions of the model are below. The census tracts that the model predicted would have a wildfire are in orange. This is a simple binary yes or no, which was the primary output of this tool prior to ArcGIS Pro 3.3.
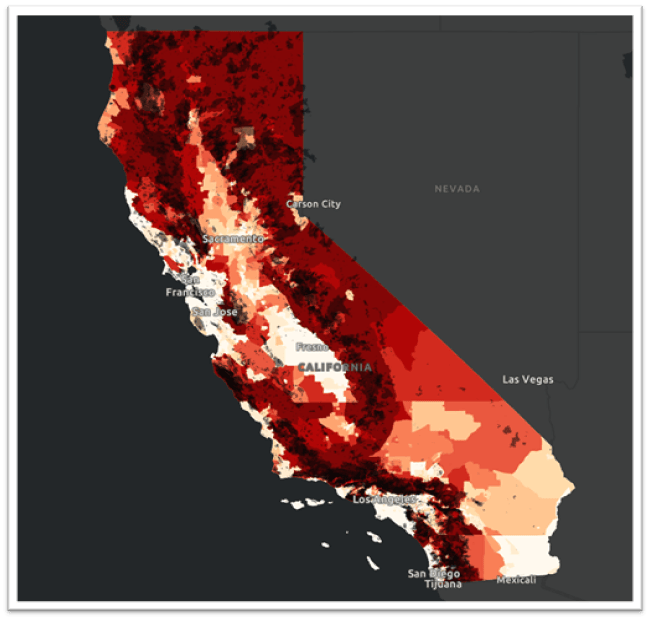
Now, the new probability output gives more granularity to that prediction. Below is the probability of the wildfire category mapped.
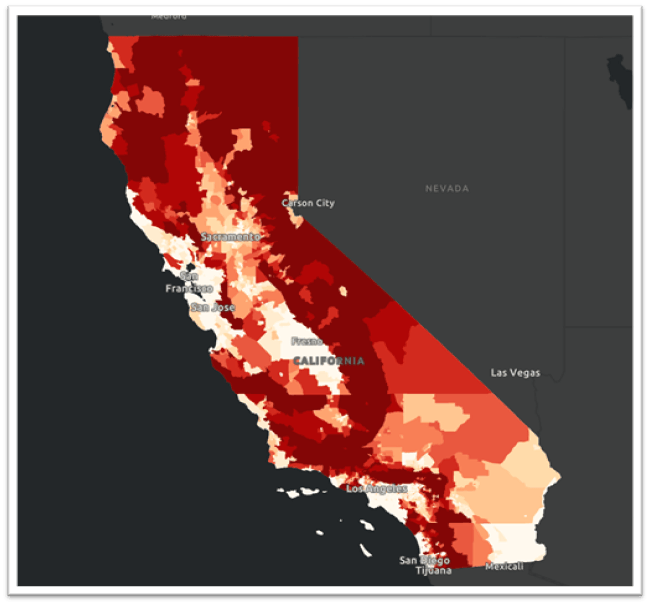
The areas in the lightest shade have the lowest probability of having at least one wildfire based on the prediction, and the darkest red have the highest probabilities. This provides a lot more power to categorical predictions. As an analyst, you will treat a wildfire probability of 5% vs. 40% vs. 80% or 90% differently.
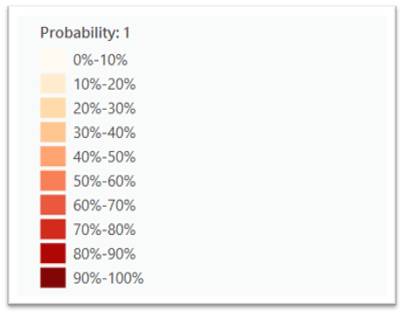
Below is a map of observed historical wildfires overlaid with the probabilities. The shades of darkest red on the probabilities map line up with the areas of observed wildfires.
As drought, weather patterns, and land use continue to change in the future, new probabilities could be calculated and assist allocation of resources.
This new enhancement to the Forest-based and Boosted Classification and Regression tool in ArcGIS Pro 3.3 brings more detail to categorical predictions and allows for more robust evaluation and actionability of your prediction results.
Learn More
How Forest-based and Boosted Classification and Regression works
Forest-based and Boosted Classification and Regression documentation

Article Discussion: