Geographic data comes in all shapes and sizes. Finding the data you need for your project is one thing, but keeping track of it inside a project with dozens of maps and hundreds of layers can be difficult. You can filter what you don’t need to see from the Contents pane, but maps are a visual experience—sometimes you just don’t want to see a layer right now. And you don’t want to keep having to make manual adjustments. What’s not currently drawing in the view still takes space in the pane and uses your system’s resources.
To solve that dilemma, ArcGIS Pro 3.1 introduces a new layer type—something we don’t get to say very often. Catalog layers may be useful for those who work with ArcGIS Pro maps or scenes that contain a large amount of data. Today we will share an example of how catalog layers can be used.
It’s called a catalog layer because its purpose is to help you organize, or catalog, your datasets. A catalog dataset is created and stored in a geodatabase and establishes item references with the data it includes. The item references point to various data sources—from local or network file shares, or your Enterprise portal.
With catalog layers, data management tasks are minimal. You’re not breaking existing data connections or duplicating anything. Think of it this way: the catalog dataset is a file cabinet. Each item reference to a dataset, feature class, or service is a file in the cabinet. You’ll frequently pull out the files you want to see, and the ones you don’t need right now are put in the back of the cabinet—but they are still in the cabinet. I’ll come back to this analogy throughout the blog because it can simplify what is going on behind the scenes.
There are core aspects to creating catalog layers, such as item type filters, that I don’t cover in this blog post. If you’re curious about how you can create a catalog dataset and establish item references, you can read the web help documentation and follow the instructions provided.

Data forecasting use case
Now, imagine you work for a natural disaster agency that collects data for an incoming Category 3 storm. You get data from models that constantly update their forecasts. The information evolves frequently and rapidly, and it comes in various stages. After the hurricane makes landfall, on-the-ground crews provide access to data they’ve collected at different times, in different formats, to your agency. It all adds up very quickly. Every piece of data is important, but consuming them all is a different story. Everyone involved in collecting, editing, and uploading the data has done their work, but now you must make something from it.
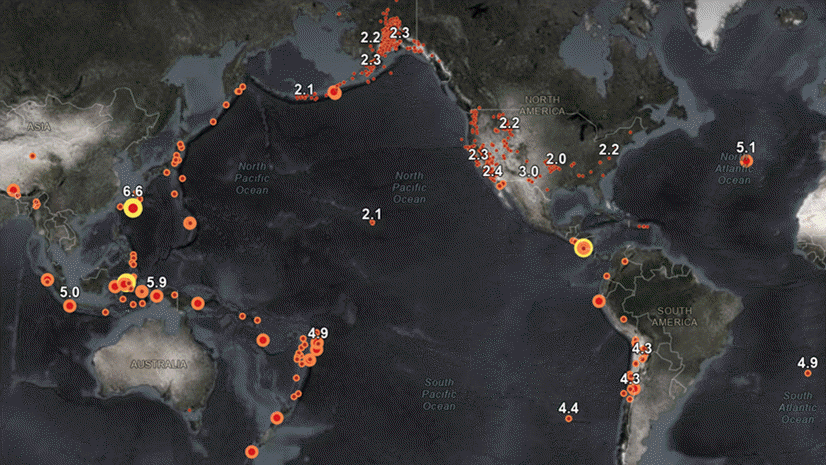
The file cabinet is overflowing—but we can manage it.
The datasets you see in the image above have been added as item references to a catalog dataset. In any map with a catalog layer, one of the two sublayers you will see is a Footprints layer. When I created the catalog dataset, it built convex hull polygons of each item’s footprint and put them into one feature layer. The footprints show the spatial extent of every item (as is done with footprints in a mosaic dataset, if you’re familiar with them). Any given layer’s spatial extent isn’t immediately clear when looking at a geodatabase or a service layer in a file directory.

If you right-click the catalog layer in the Contents pane and open its attribute table, you will see that each item is a record in the table. The Item Source field stores the path of the item. Meanwhile, the Item Type field tells you what kind of data it is. It’s like the files in your file cabinet tell you what’s inside without needing to open them. The other fields you see are detailed in the help documentation, and you can add your own fields too. More on that later.

The second layer in the catalog layer’s structure is named Layers In View. It is a composite sublayer that does exactly as the name implies. Catalog layers dynamically load layers in your map based on spatial, temporal, or range filters. If an item in your catalog layer is in view, it is listed in the Contents pane under the Layers In View heading. In this example, there isn’t any data covering Jamaica. If we pan over to Cuba, a footprint comes into the map’s view. This is the Hurricane Irma track sublayer, which appears in the Contents pane. Catalog layers apply a default layer limit of 10, but this can be changed.

But which layers get drawn? That’s where the Feature Order Weight field in your catalog layer’s attribute table comes into play. Feature drawing order was introduced in 3.1, and catalog layers include it as one of the default fields. You can edit which items are drawn on top by giving them a larger value—like keeping your most important files toward the front of the file cabinet.
The southeastern United States was impacted by Hurricanes Irma and Maria in September 2017. In our example catalog dataset, we have data from both hurricanes. You can set a definition query on the catalog dataset; you can also set a time filter to look at information collected during the period that one of the hurricanes made landfall. In the example below, we use a definition query to only show data related to Hurricane Irma.

There are other ways to limit what gets drawn, as well. You can modify the layer limit, or you can also set scale ranges for each item in your dataset. These settings will be reflected in your map as you change scales.

Lastly, the contents of a catalog dataset include feature classes, BIM files, LAS datasets, and so on. But because each of these things are references to the data—not the actual items—there are limitations with what you can do. In almost all cases, consider catalog layer contents as read-only. That means you cannot view a sublayer’s attribute table, make edits to its features, or make changes to the symbology.
However, there is one solution. You can right-click any item reference in the catalog layer and choose Make Layer from Catalog Dataset Item. This builds the item as a separate layer in your map with all the functionality that normally comes along with it. Meanwhile, the item remains a member of the catalog dataset.

To summarize, consider adding catalog layers into your current workflows. There are an abundance of tips and tricks—such as how to share your catalog layer to an Enterprise portal—but we’ll come back to these things at another time. Until then, read our help documentation to learn more, and share your thoughts or use cases with us on the ArcGIS Pro page in the Esri Community.
We’re also providing the catalog dataset used in this blog’s example as a starting-off point for your learning experience. Feel free to download the package in ArcGIS Pro 3.1 and experiment with the layer as you see fit!
Thank you!


This brings back some good old memories to the Theme and Catalog Browser extension I developed and made available on ArcScripts for ArcView 3.x in a distant past ;-)… Those were the days…