There’s an endless flow of digital content hitting the internet.
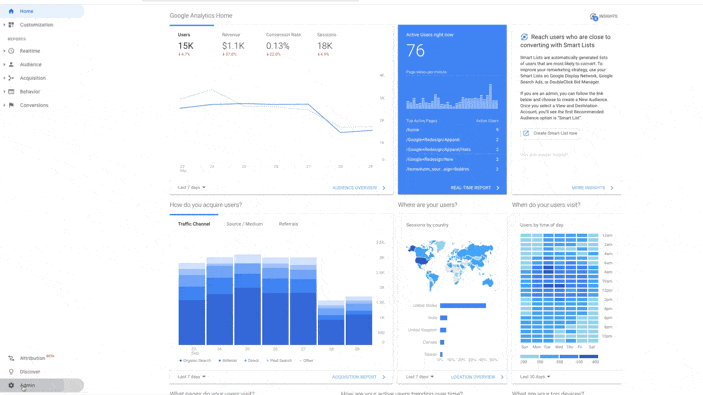
Trying to determine if your story map is connecting with your audience may seem like a daunting task but it doesn’t have to be. With any item that’s created on ArcGIS Online you can see your item views and quickly understand how your story is performing compared to other ArcGIS online items. However, it doesn’t allow you to compare your story to other websites or provide detail on how your readers are engaging with the story.
That’s why we’ve made it possible for authors to track their story’s performance by using Google Analytics together with ArcGIS StoryMaps. Understanding your audience is essential if you want to be a successful story map author. Google Analytics allows you to collect anonymous tracking data and can help answer questions like: How is my story map performing alongside other web content? How are people finding my story map? Does my audience primarily speak the same language? Are they reading on a desktop computer or a mobile device? Where in the world are people viewing my story? How many clicks are we getting on each map, button, or link in a story?
Using Google Analytics in your story map makes answering these questions super easy.
Getting Started
First, make sure you have a Google Analytics account. Check with your website administrator or your marketing team if you’re unsure. If you don’t already have an account, consider signing up—it’s free and easy to get up and running.
Once you have an account, you’ll need to locate your tracking id number to plug into your story map. This can be a little tricky to locate. The Tracking ID can be found in the Admin section of your analytics page under Tracking Info and Tracking Code. Copy this number to your clipboard. It should look something like this: UA-XXXXXXXX-X
If you’ve upgraded to Google Analytics 4 you’ll use your Measurement ID. The Measurement ID can be found in the Admin section of your analytics page under Data Streams and Measurement ID. Copy this number to your clipboard. It should look something like this: G-XXXXXXXXXX.
Now you’re ready to plug it into your story. Open a new browser and navigate to ArcGIS StoryMaps, then launch the builder for the story you’d like to start tracking. Next, open the Story Settings using the … menu in the story header. Click on the Analytics option at the top. Check Enable Google Analytics and paste in your Tracking ID or Measurement ID. Finally, click save and publish your story—it’s that easy.

If you add analytics to a story, you can include a consent message and give your readers the choice to opt in or out. Adding a consent message is optional and up to the story author. It’s important to check with your organization’s policies for data collection. Remember all the data you collect with google analytics is anonymous, there is no personally identifiable information collected.
You’ll know it’s working when you see the information for the story such as the URL show up in your Google Analytics account. Not seeing any metrics yet? Don’t worry, over the next few days check back in as metrics accrue, and make sure you have the tracking date range set to overlap with when you added it to your story.

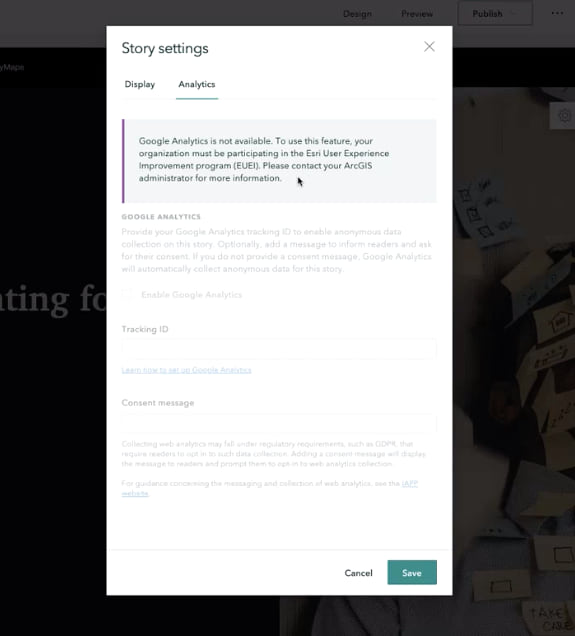
Google Analytics not available?
If your organization is not part of Esri User Experience Improvement program (EUEI) you will receive a notice saying “Google Analytics is not available…” You must enroll in the program to be able to use Google Analytics in your account. Your ArcGIS administrator will be able to enable this for you by opting into the Esri User Experience Improvement program. This is a protection for organization accounts to have more control over how data is collected using Esri tools.
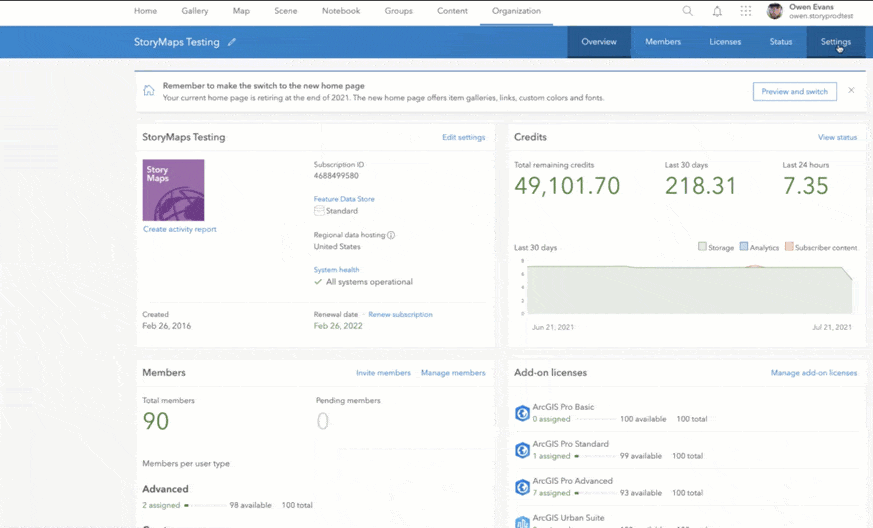
If you are an ArcGIS organization administrator, this is how you join the EUEI program. Login to your ArcGIS organization account and click Settings. In the general table there’s an option called Esri User Experience Improvement program. You need to enable this option to be able to use Google Analytics in your story. Once you enable this, your ArcGIS StoryMaps authors will be able to add in Google Analytics to their stories. For more information about this requirement, see Add analytics to a story in the ArcGIS StoryMaps documentation.
Measuring Engagement
It’s exciting when a story has thousands of views, but have you ever wondered how your readers are engaging with your content? Are readers clicking on buttons? Exploring a map? Or playing an embedded video?
You can gain insights into engagement by digging deeper into the behavior statistics in Google Analytics. ArcGIS StoryMaps has built in code that will report the number of clicks on each map, button, and link in the story to your Google Analytics. This provides valuable information about which parts of your story readers are interacting with.
When would this be useful?
- You’re a non-profit and want to see how many people are clicking on a donate button in your story.
- You want to see if people are engaging with an interactive map or scrolling past it.
- You want to see if you’re holding readers’ attention through the whole story by comparing the level of engagement at the beginning with that toward the end.
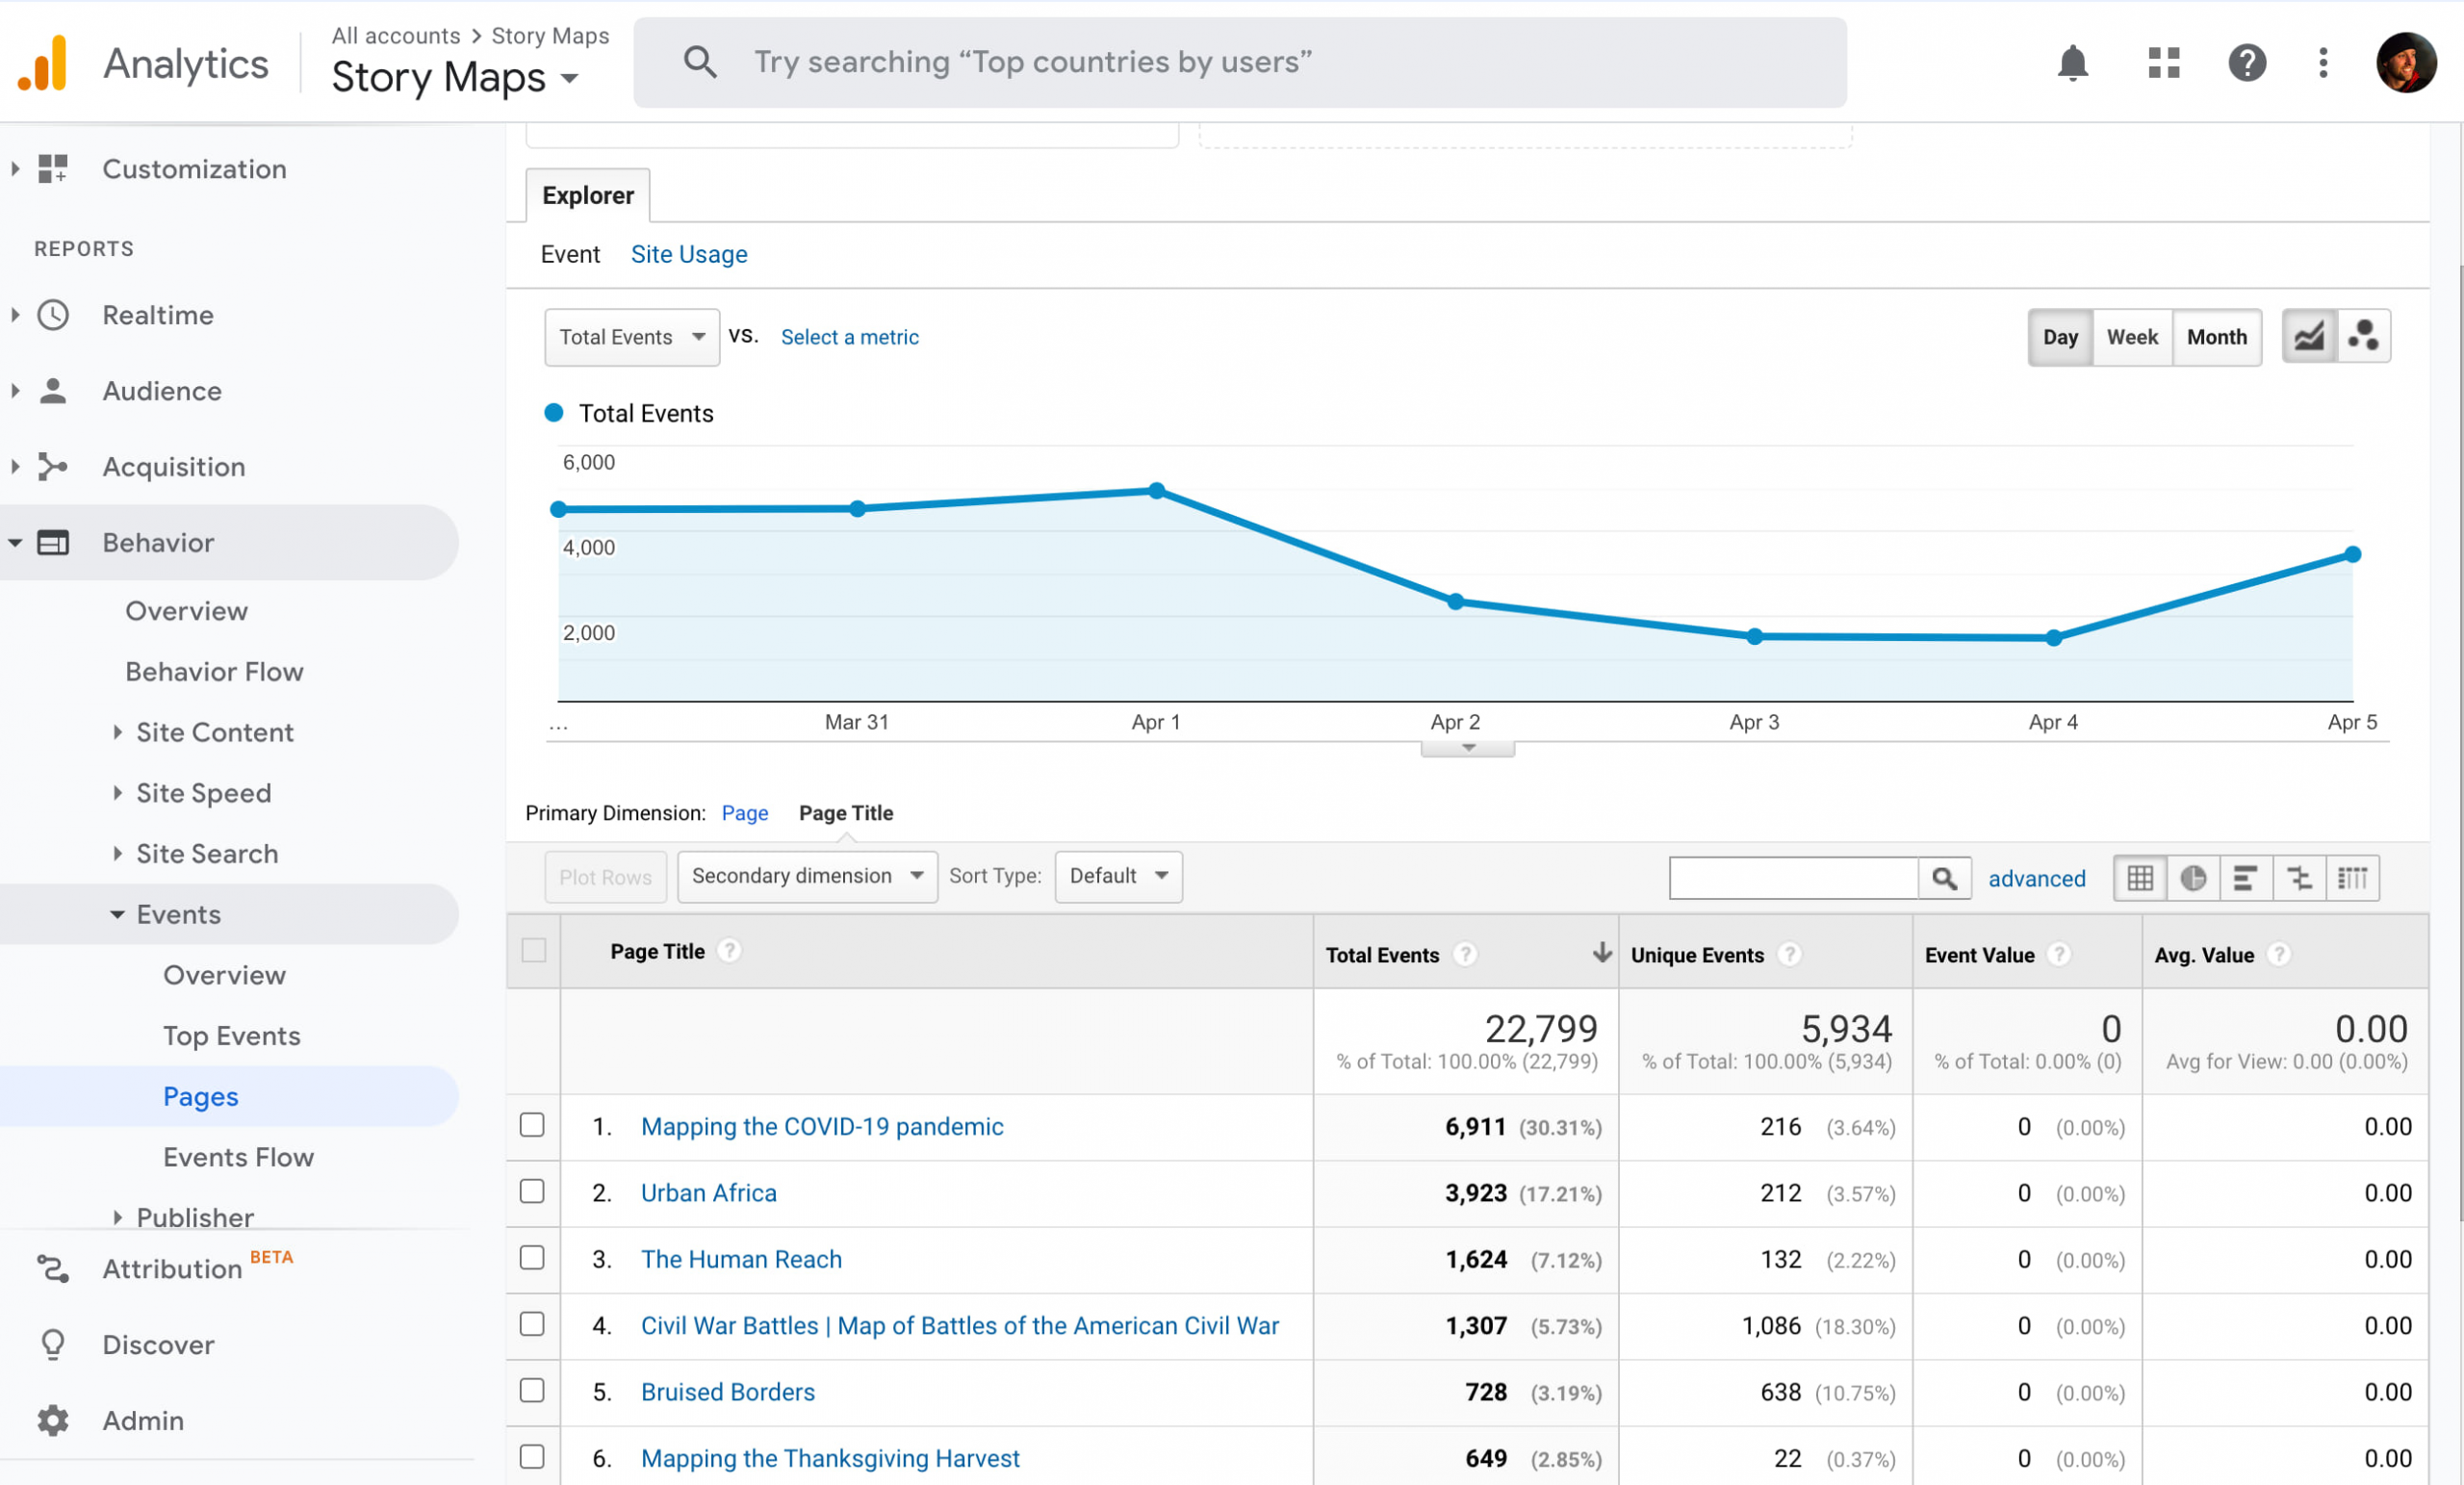
To explore these statistics sign in to your google analytics account, click Behavior, click Events, and you can get an overview of reader engagement. If you want to look at engagement on a specific story, click on Pages and find an individual story. It can help to search by Page Title in your Primary Dimension.
Some additional (cautionary) notes about Google Analytics. Google Analytics has an endless number of metrics within the tool. The metrics you choose to pay attention to will depend on the goals of your story.
Here are a few things to keep in mind as you get started using Google Analytics.
- It’s not always about the number of page views but who is viewing your story. Reaching your core audience is often more important than having a high number of views.
- Google Analytics should be used to give general impressions of your story performance. It should be one of a number of factors that influence how you measure the success of content you develop. Use it as a directional indicator to give general usage and viewership.
- Coordinate with team members to explore and learn from each other to understand what key performance indicators work best with the goals of your story and your organization.
- Give your content two months of tracking before you try to glean actionable insights from it. This accounts for anomalies in viewership or random occurrences (like checking on your story map when you first publish it) .
If you’re new to Google Analytics I recommend you spend a moment digging deeper into these resources:
- A Complete Beginner’s Guide to Google Analytics
- Video tutorials
- Getting started with Google Analytics 4
- Google Analytics 4 support


Thanks for this post, Ross!
Is there a way to do this with a StoryMap Collection? It is my understanding, if you have a collection of story maps, one data stream would allow you to see traffic between story maps in the collection.
Hi Lily, thanks for reading the blog. StoryMap Collections do not have data analytics integration at this time. I will share this use case with our developers. Have you considered using UTM links in stories to see if users are clicking from stories to your collections?