In this blog, we will cover how to create a near-real-time analytic by configuring a big data analytic to run periodically and process data collected since the last run.
What is ArcGIS Velocity?
ArcGIS Velocity is the real-time and big data capability in ArcGIS Online that works, at scale, to process your streaming and historical spatial and IoT data in ways that allow you to gain insights and take action in real-time. This software-as-a-service (SaaS) offering enables the configuration of feeds which ingest and visualize real-time sources of data. Additionally, users can create real-time and big data analytics to perform a variety of analytic workflows related to IoT and big data.
Near-real-time analysis with big data analytics
While real-time analytics process each event immediately as it is received, big data analytics process batches of collected data to identify patterns and trends over time. In addition to these capabilities, big data analytics can also be scheduled to run periodically or at a specific recurring time.
When configured to run periodically, a big data analytic essentially becomes a near-real-time analytic. Every specified number of minutes, the big data analytic runs, loading and processing updated collected datasets in the analytic. Many workflows are possible with near-real-time analysis since they operate on a set of data, whereas a real-time analytic processes each message individually.
Consider some examples of near-real-time analysis:
- A city wants to provide citizens with up-to-date public parking information throughout the city including the location of available parking spaces, and the number of parking spaces available on each street. Every two minutes a big data analytic runs that calculates and summarizes the amount of parking available throughout the city for each street segment.
- As a police dispatcher you’re responsible for monitoring officer locations across the response areas. Every two minutes spatial summarization analysis is performed on officer locations within these response areas. If a response area is lacking a minimum threshold of available officers, an email notification can be automatically sent to the dispatchers so that they can act and redirect officers accordingly.
Near-real-time analysis in action
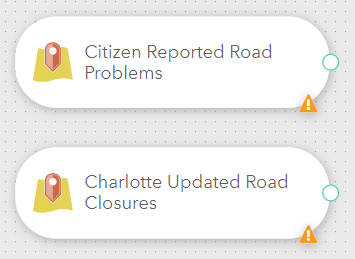
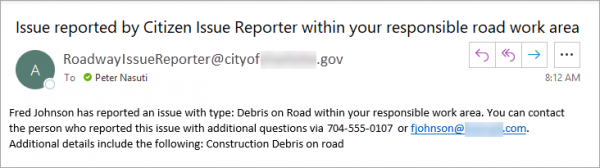
Now, let’s take a closer look at how you can perform near-real-time analysis in ArcGIS Velocity. In this scenario, we’ll assume the role of a city transit department, in this case in Charlotte, North Carolina, and we’ll say we are working to more quickly and efficiently respond to citizen concerns and issues regarding public roadways. Let’s assume that the city’s GIS department has already configured a GeoForm configurable app to collect issue reports. This app provides the citizens with an easy-to-use interface to report issues such as potholes, missing signs, debris on road, and more.

In this example, we’ll utilize ArcGIS Velocity to create a near-real-time, big data analytic that loads the most recent issues reported by citizens and processes them. Once an issue is submitted it is analyzed and, depending on the type of issue, directed to one of the different city departments.
For the purposes of this scenario, let’s also say that when roads are closed, there’s an increase in the number of issues reported near that road closure. Therefore, we want to direct any issues within a certain distance of a road closure to the corresponding site manager. As a result, that site manager will be immediately notified about the issue and can facilitate a quick resolution.
To summarize, the goals of this use case are:
- Load only the most recent issues reported by citizens every time the analysis runs
- Load the most recent road closure features every time the analysis runs
- Direct reported issues to the relevant person or department depending upon the type, time, and location of the reported issue
- Perform the analysis every few minutes to keep up with the incoming information
Configure ArcGIS Velocity to address these needs
Load only the most recent issues for each analytic run
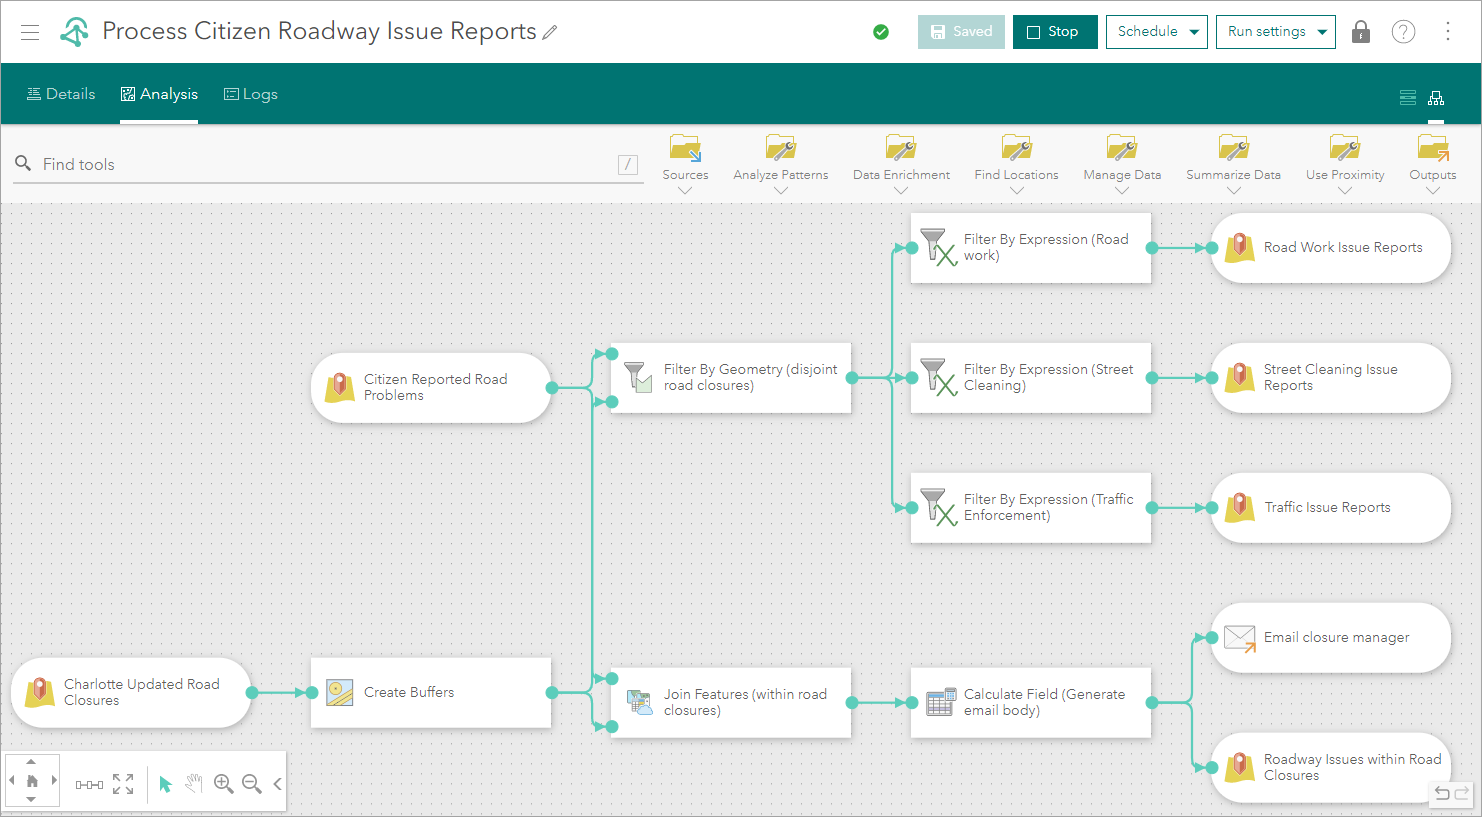
To get started, we’ll create a new big data analytic. The first step is to configure a data source. The GeoForm app adds reported issues as features to a feature layer. Therefore, we’ll configure a Feature Layer data source to load features collected by the app into the big data analytic for processing.
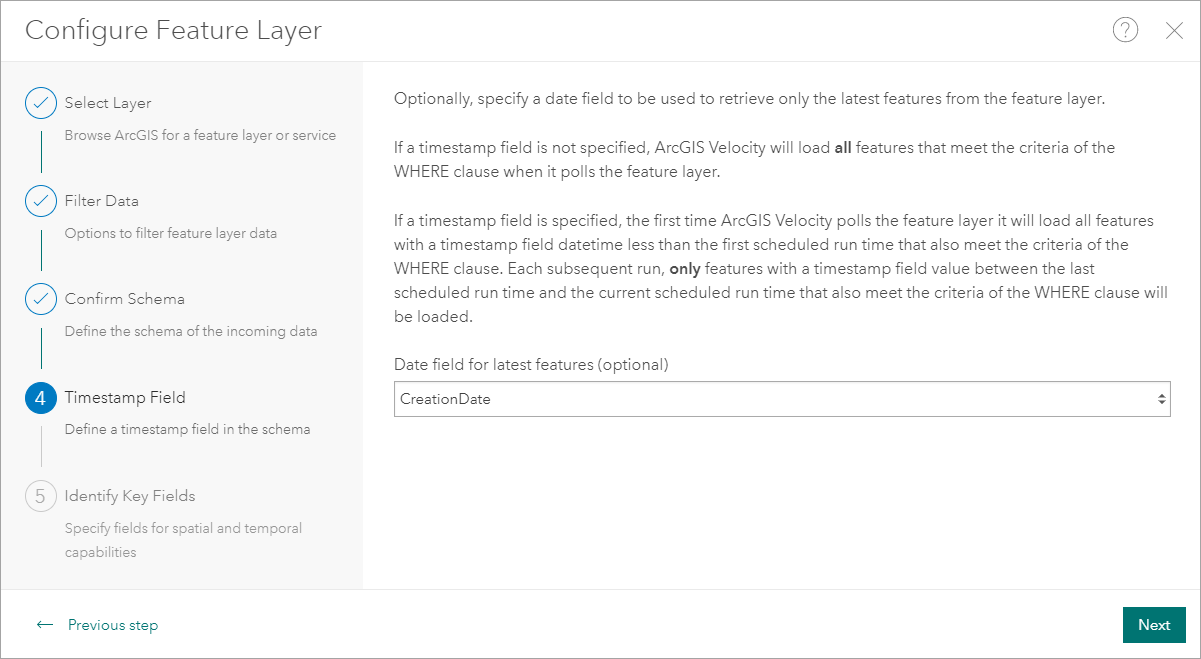
Now, when performing near real-time analysis, we only want to load in the most recent features reported by citizens. We can do this by specifying a Timestamp field on the feature layer source. When a field is specified in this Timestamp field parameter, the feature layer source will query the feature layer to only load features relevant to the current analytic run.
Our feature layer has editor tracking enabled, and therefore has a CreationDate for each feature. We’ll choose this field as the timestamp field.
With this setting when the analytic is started the first time, ArcGIS Velocity polls the feature layer and will load all features with a timestamp field datetime less than the first scheduled run time that also meets the criteria of the WHERE clause. For each subsequent run, only features with a timestamp field value between the last scheduled run time and the current scheduled run time that also meets the criteria of the WHERE clause will be loaded.
For example, if the analytic runs every 5 minutes, for the 10:30am run, the analytic will load features with a CreationDate greater than 10:25am and less than 10:30am.
This expression is specified when configuring the feature layer data source on Step 4: Timestamp field, using the dropdown:
Notify road closure site manager of roadway issues reported nearby
The second goal of this use case was to direct any citizen reported issues within a certain distance of a road to the site manager responsible for that road closure.
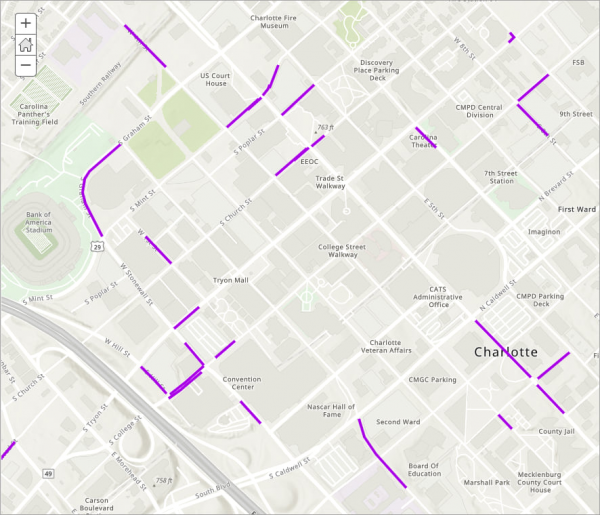
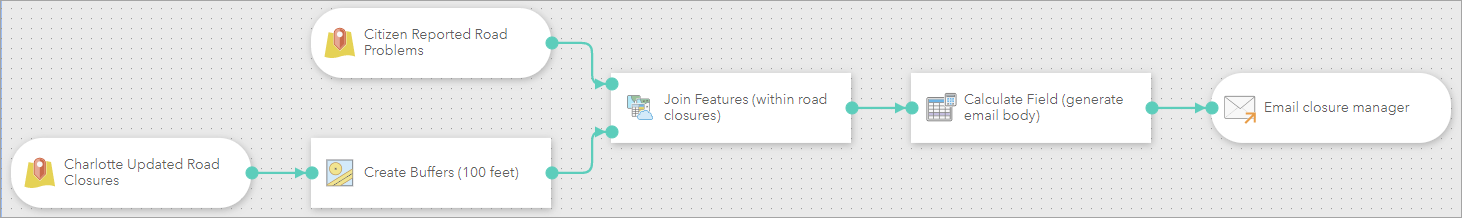
The road closures dataset is updated frequently and therefore each time the analytic runs it also needs to use the latest state of road closures. For this, another feature layer data source can be configured to consume data from the road closures feature layer provided by the city.
Once the road closures data source is configured, these polyline features are buffered by 100 feet to create polygon features. Next, the Join Features tool can be used to identify the GeoForm-reported issues within the buffered road closures. The Join Features tool also allows the contact email of the site manager to be joined from the official road closure to the reported incident.
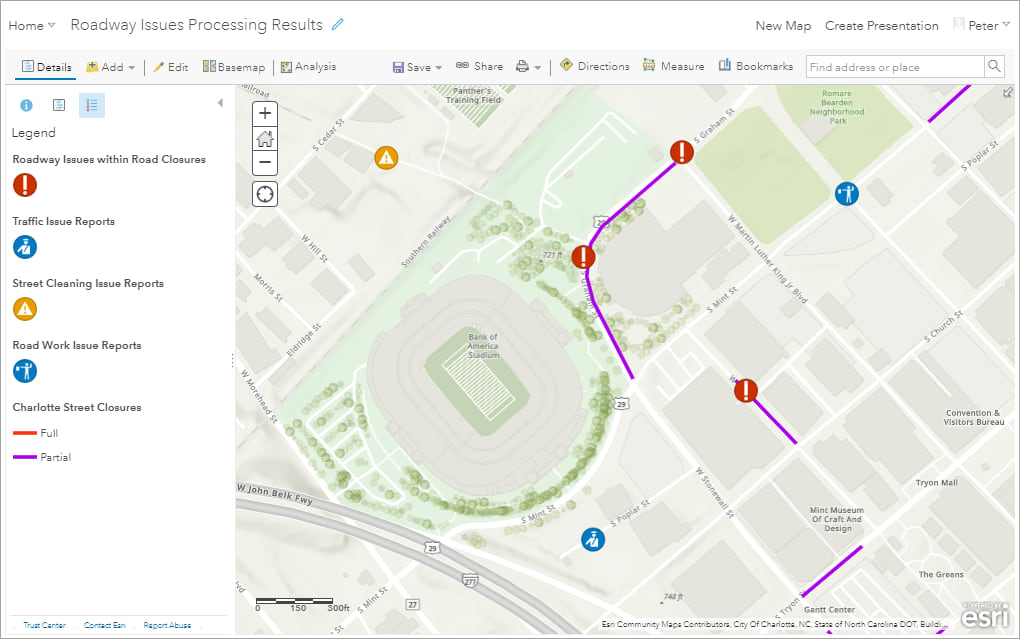
After joining and enriching the reported issue with information from the road closure, an email body is generated using the Calculate Fields tool and the process concludes with an Email output. As a result, any citizen reported issue feature that falls within 100 feet of a city road closure will trigger a notification email with relevant details to the site manager of that road closure.
Process remaining reported roadway issues
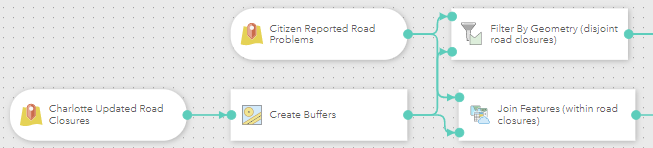
At this point, we still need to process citizen reported roadway issues that are not within the proximity of a road closure. To achieve this, we’ll configure a Filter by Geometry tool with a disjoint spatial operation from the buffered Charlotte Street Closures. This isolates the citizen reported roadway issues that are not within 100 feet of road closures.
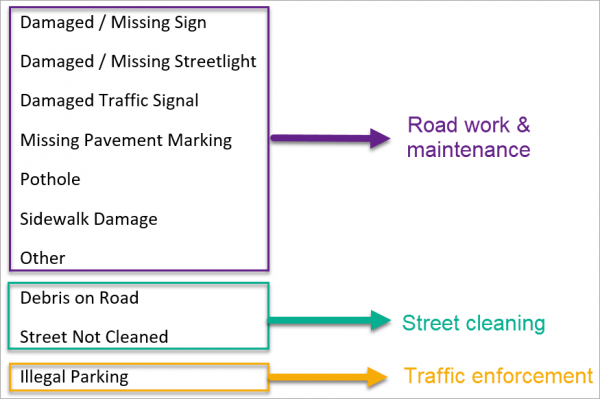
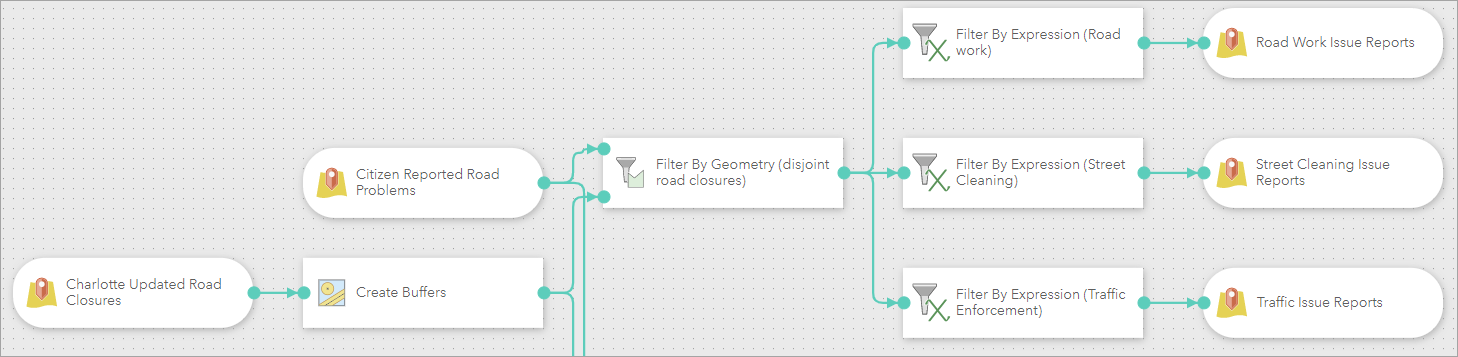
Now that we’ve identified features that are not near road closures, we want to split reported issues based on their type, so they can be directed to the Road Work & Maintenance, Street Cleaning, or Traffic Enforcement departments accordingly. This is accomplished using three different Filter by Expression tools.
Once we’ve broken out the citizen reported issues by type, they can be sent to respective feature layer outputs for integration into other systems or daily reports and applications.
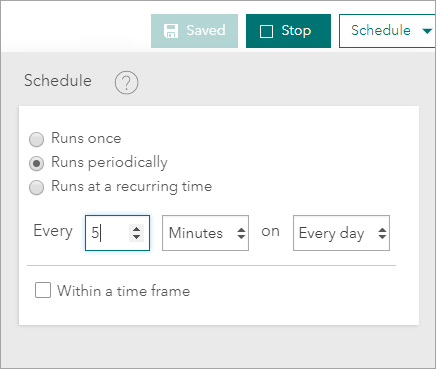
Configure analysis to run on a schedule
Finally, we need the big data analytic to run periodically in order to continue producing action and outputs as citizens are reporting roadway issues. To achieve this, we’ll configure the analytic to run on a schedule. Big data analytics can be set to run periodically such as every 5 minutes or once an hour, or to run at a recurring time such as 9am every day. This can be configured in the upper right of the analytic editing interface using the Schedule button. For more information, see Schedule recurring big data analysis.
Summary
With the above approach, we now have a big data analytic configured with two feature layer data sources, tools and outputs with various processing pipelines, and a schedule to run the analytic every 5 minutes. Once the analytic is started, any citizen reported roadway issue will be sent to the appropriate site manager or updated in an output feature layer for integration with other downstream department actions.
Interested in learning more? Check out the other ArcGIS Velocity blogs and read more about near-real-time analysis in the product documentation. You can also learn how to get started with ArcGIS Velocity using this Learn ArcGIS lesson. Please reach out and let us know if you have any questions about any capabilities in ArcGIS Velocity.

Article Discussion: