ArcGIS GeoAnalytics Engine is a plug in for Apache Spark that provides a collection of spatial SQL functions and spatial analysis tools. With GeoAnalytics Engine, you are now able to carry out your spatial analysis workflows within your Cloud platforms or on-premises infrastructure.
In her demo at this year’s Developer Summit Plenary, Xirui leverages GeoAnalytics Engine within an Azure Databricks hosted notebook to perform custom big data analysis.
311 systems provide non-emergency services through channels such as phone calls and smart phone applications. Xirui’s demo investigates which areas in New York City experience long response times to 311 calls of the same complaint type. Understanding where there are slow responses to similar 311 requests can help city workers determine how to better respond to their city’s needs.
Prepare data and workspace
Before she performs her analysis, Xirui carries out the following workflow to prepare her data and workspace:
- Create a cluster.
- Open a PySpark notebook.
- Import the geoanalytics and pyspark modules.
- Sign into GeoAnalytics Engine using a GeoAnalytics Engine username and password.
- Load the input CSV dataset from Azure blob storage into a PySpark DataFrame.
- Clean data and set location and time fields.
The dataset used in this demo contains 27 million records of 311 calls in NYC from January of 2010 to February of 2022.
Analyze data using GeoAnalytics tools
Xirui is now ready to begin her analysis. First, we need to identify which records in the dataset have long response times.
To address this, Xirui calculates the mean duration plus three standard deviations of all response times. She then filters through the dataset to select records with response times longer than the calculated value.
Now that we have selected records with long response times, we need to know where groups of similar service requests are located. Xirui uses the Group by Proximity tool to identify these groups.
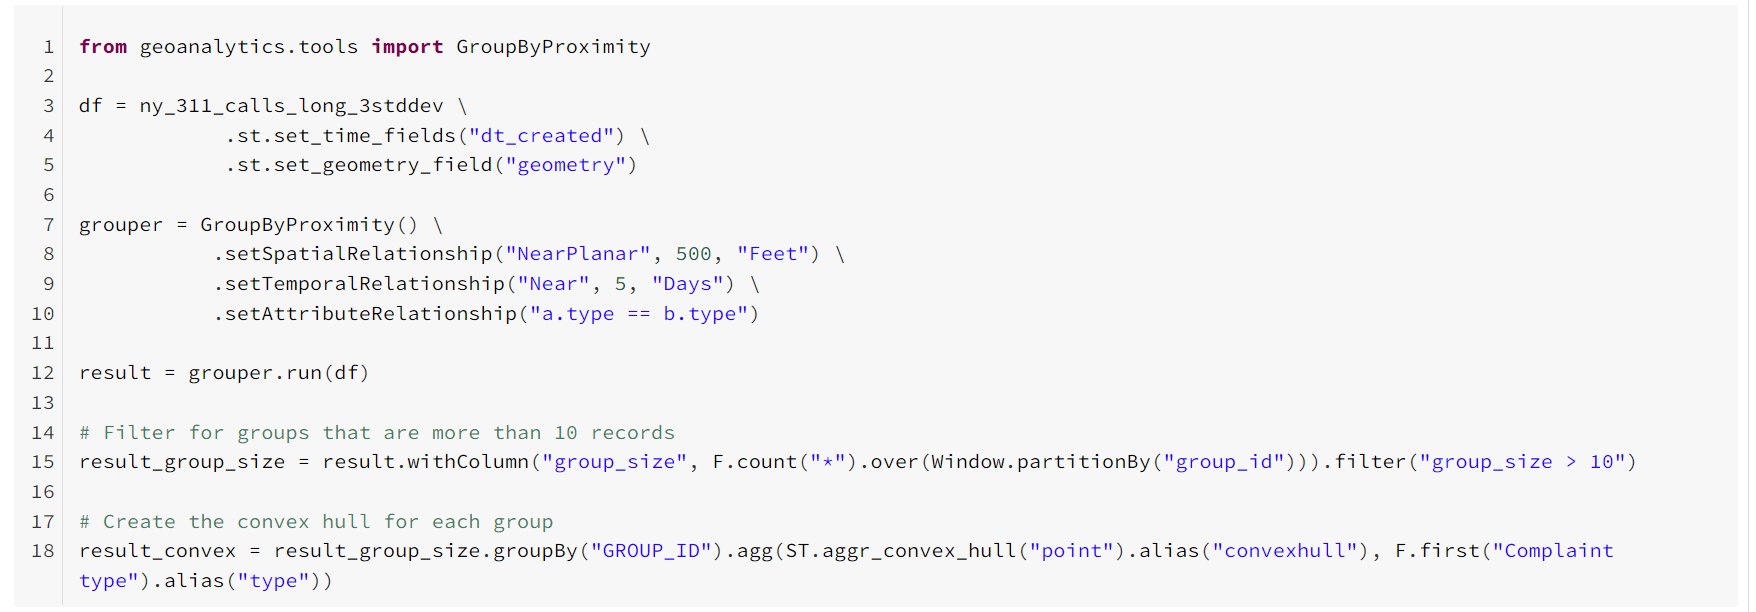
The Group by Proximity parameters are set so that the tool will find groups of the same complaint type that occur within 5 days and 500 feet of each other. Xirui further narrows her results down to groups of more than 10 records.
As a result of Xirui’s analysis, we have located groups of 311 calls in NYC that make similar service requests and are met with long response times.
Visualize results
To visualize the results of her analysis, Xirui creates convex hull polygons around each call group. She then plots the polygons with a New York City census block dataset.

The resulting polygons represent areas in New York City with high concentrations of the same type of long-response calls. We see as a result of this analysis that noise complaints appear frequently and are slow to be addressed around mid and lower Manhattan. We also see that sidewalk service requests around Brooklyn and Queens experience long response times.
Conclusion
Knowing the types of 311 service requests and their spatial distributions can help city governments better allocate their resources and serve the needs of their residents.
With GeoAnalytics Engine, you can leverage distributed computation and the Spark API through your cloud platform. This means you are able to complete spatial analysis workflows, like Xirui’s demo, where your datasets and infrastructure reside.

Commenting is not enabled for this article.