Many people understand the power of GIS for quantitative research, but fewer know of its practical applications for qualitative social science work. Qualitative data is non-numerical, descriptive, and unstructured. Examples of qualitative social science data include things like open-text survey responses, ad hoc or unstructured feedback, user-defined attributes, field notes and reflections, interview recordings and transcripts, and photos and videos taken by researchers and participants. In this article, we’ll describe three key resources you can use in your qualitative social science research to enhance your data and analysis.
1. The Enhancing Qualitative Social Science Research with GIS ArcGIS StoryMap
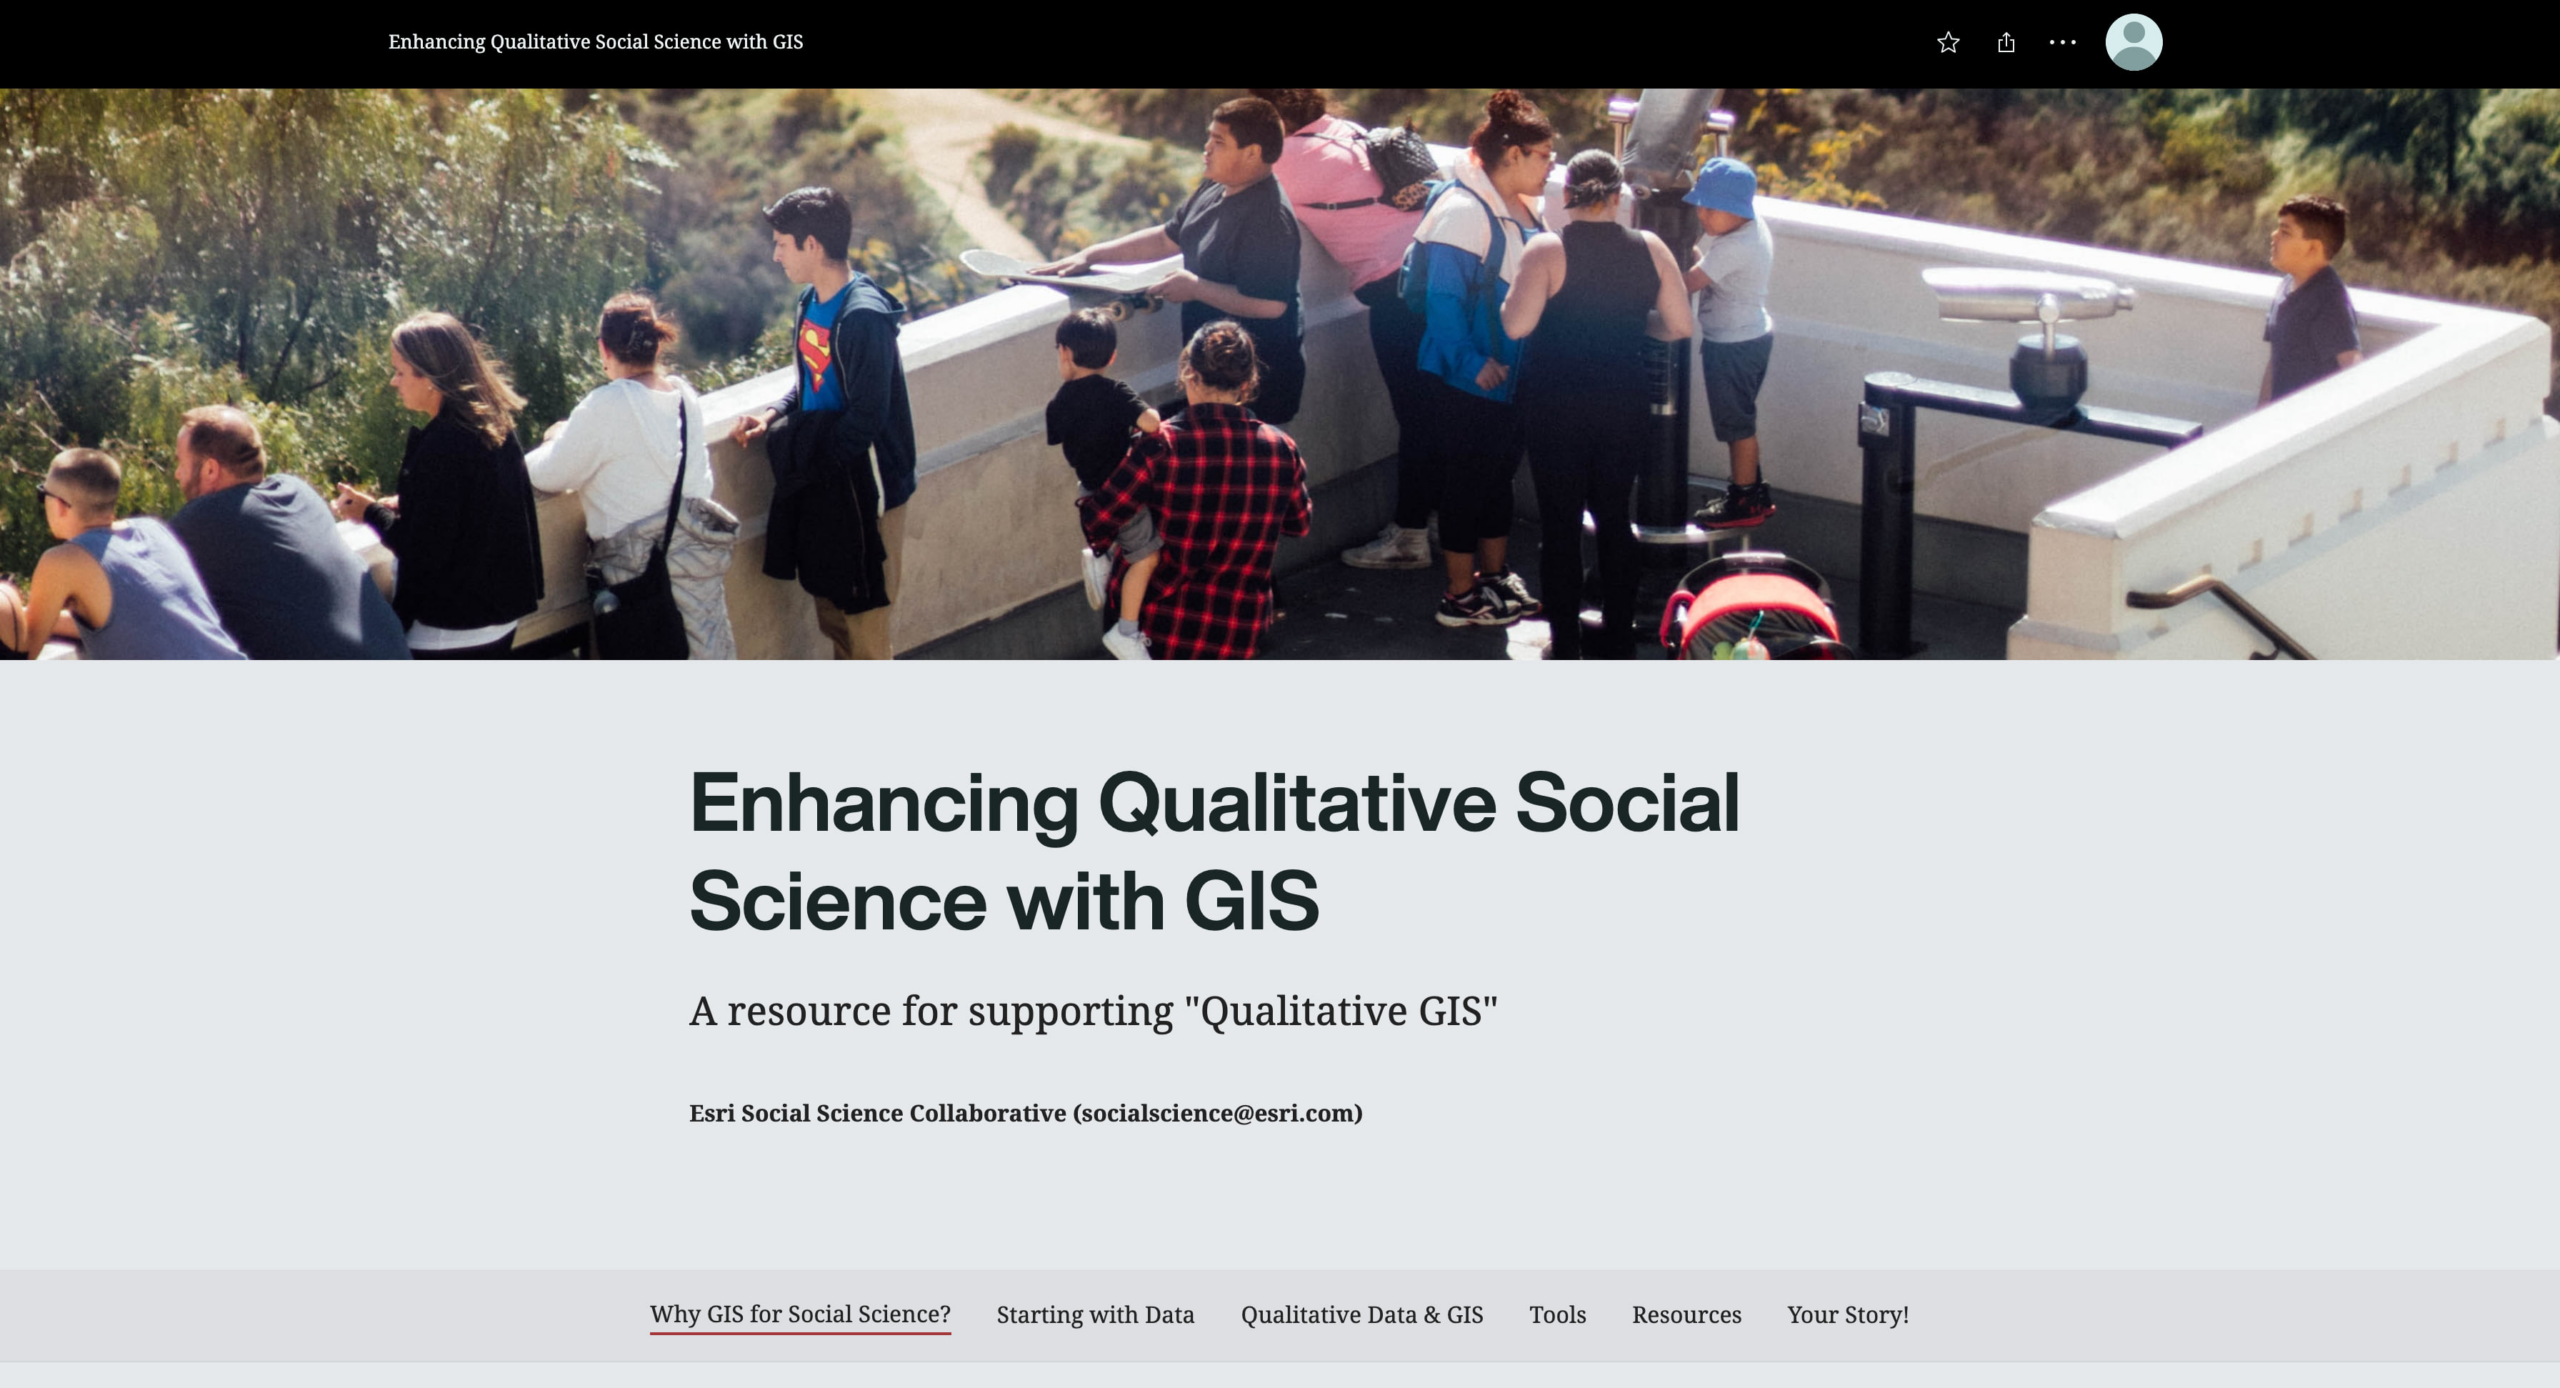
The Enhancing Qualitative Social Science Research with GIS ArcGIS StoryMap serves as a guide for using Esri’s technology to conduct qualitative social science research. The StoryMap begins by breaking down key differences between quantitative and qualitative research and emphasizes how qualitative research empowers study participants to convey their experiences in their own terms. For example, participatory sketch mapping allows study participants to contribute local knowledge of changes, boundaries, and perceptions in their community by annotating base maps.

The StoryMap also features case examples, tools, and resources, to show researchers how to use qualitative GIS in social sciences studies.
2. Enhancing Qualitative Social Science with GIS Technical Workshop
This workshop presented at the 2021 Esri User Conference showcased how ArcGIS products can be used for data capture, coding, and workflow analysis. The presentation reveals various methodologies researchers from diverse disciplines use to combine qualitative data with spatial data. It also includes demonstrations of Esri technology for text analysis (especially on unstructured data), participatory research, integrating qualitative and imagery data, sketch mapping, and multimedia narrative storytelling.

“While qualitative and GIS methodologies have often been seen as at odds with one another, over the last decade or so, that perception has changed.” Said Kyle Jones, PhD, UX Researcher Lead at Esri.“Researchers and practitioners across various fields have sought out new ways to understand the importance of space and place and are interested in utilizing new technologies to do so.”

“Researchers and practitioners across various fields have sought out new ways to understand the importance of space and place and are interested in utilizing new technologies to do so.”
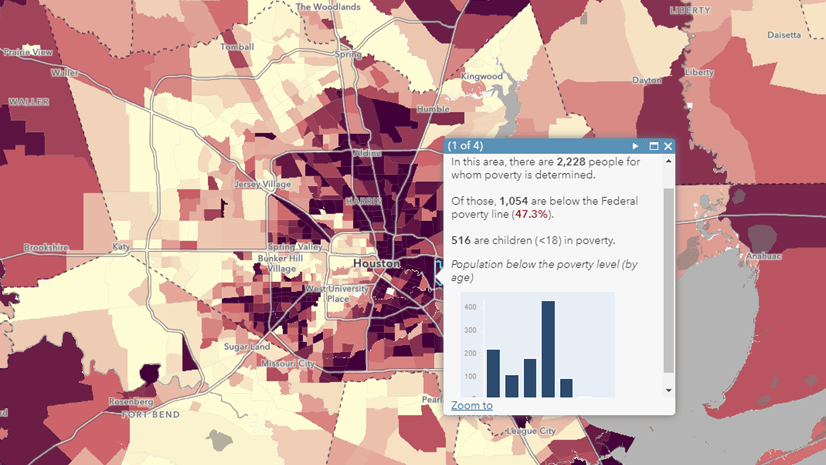
Presenter Lakiesha Coleman, a Solution Engineer at Esri, used ArcGIS StoryMaps Express Maps for her recent study, “Navigating Food Deserts: A Geo-Ethnography of Atlanta Residents’ Experiences, Routines, and Perceptions”. With the aim of eliminating food deserts, Coleman wanted to understand why Atlanta locals traveled to certain grocery stores in their community. She asked participants to add their home, work, and primary grocery store as points to a map of their neighborhood. Once completed, Coleman added the precise locations, allowing her to compare the participants’ perceived geography with the neighborhood’s actual geography. By allowing participants to show her what they understood about their own location, Coleman avoided making assumptions about their spatial understanding. “Adding a qualitative element to my quantitative data, allowed me to gain a more comprehensive understanding of my study,” explained Coleman
 and home location (black pin), alongside there actual home location (black dot) and local grocery stores (green dots)")

“Adding a qualitative element to my quantitative data, allowed me to gain a more comprehensive understanding of my study.”
3. Social Science Website
With the Esri Social Science site, professionals and researchers can leverage examples of notable quantitative and qualitative social science research that uses ArcGIS technology.
One resource highlighted on the site is the US Department of Housing and Urban Development (HUD) Geospatial Storefront. It allows users to search through HUD’s geospatial datasets, and access web-based mapping tools and application programming interfaces (APIs). In addition to datasets, site visitors to the Esri Social Science site will find examples of GIS books, including the Esri Press book “Resilient Communities Across Geographies”; articles, like Maps for Data-Driven Policy; and case studies such as the GIScience Response to the Covid-19 Outbreak resources.
Have questions on how to enhance your social research? Email us at socialscience@esri.com


Article Discussion: