ArcGIS Business Analyst users can generate batches of infographics through the Summary Reports geoprocessing tool. Batching saves time and clicks if you need to deliver neatly presented data in stylistically appealing, themed templates for multiple areas (also known as “batch infographics”). Unlike manually selecting individual features to generate infographics, using the Summary Reports tool allows you to create multiple infographics at the same time for each polygon in the input Boundary Layer.
Batch infographics were introduced in the ArcGIS Pro 2.7 release for all Business Analyst datasets when connected to online data. More recently, we expanded the capability for use with locally installed Business Analyst datasets. This update allows infographics to be generated from behind your firewall, which has been a customer request from a broad spectrum of industries. Batch infographics with local data are currently enabled by downloading and installing a data patch, as discussed below. This functionality will be fully supported by default, with the summer release of the US_ESRI_2021 dataset.
Let’s first walk through the process of generating batch infographics from an online data source. Then, I’ll outline how to update your locally installed U.S. dataset to enable the same infographic functionality behind a firewall.
Generate batch infographics from an online data source
The first step in creating batch infographics is to set your Business Analyst data source to the online country dataset that contains your polygons. To do this in ArcGIS Pro, open the Analysis ribbon and expand the Business Analysis drop-down menu. At the bottom of the menu, click Change data source.

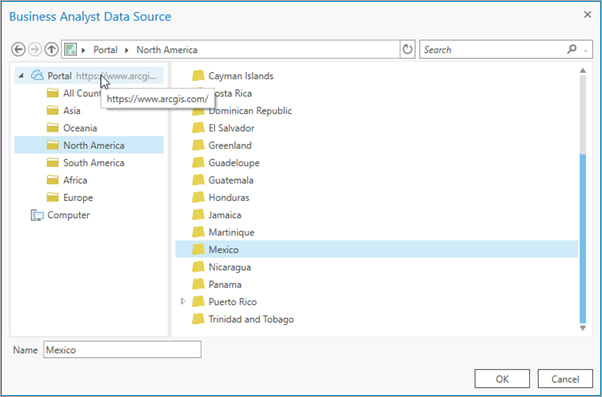
In the Business Analyst Data Source window, click Portal at the top of the left-hand menu and then select from the available continents and countries.
Once you’ve selected a country dataset, the infographic templates available for it will be listed in the Create Reports drop-down menu when you open the Summary Reports tool.
To open the Summary Reports tool, do the following:
- Open the Geoprocessing pane and select the Toolboxes.
- Expand the Business Analyst Tools.
- Click Reports.
- Click Summary Reports.
To generate infographics for all your polygons in a single pass, do the following:
- Select any polygons as the Boundary Layer.
- In the Create Reports drop-down menu, expand the Standard Infographics
- Select the infographics you want to generate and click Run. (You can select more than one infographic.)

By default, Infographics are saved as PDF files. For a more interactive experience, you can change the output format to HTML. This allows you to dynamically drill into the data, charts and maps.
Generate batch infographics with local data
Whether you work in a disconnected environment or simply do not want to use credits, installing the U.S. 2020 data patch enables access to U.S. standard infographic templates from your locally installed Business Analyst dataset. Here is how to do it…
If you are using the locally installed US_ESRI_2020 Business Analyst dataset, download the U.S. 2020 data patch, containing infographic templates, updated data collections, and a new dataset_descriptions.xml. This Knowledge Base article outlines how to install the updated files from the patch. I also explain the process below.
To download and install the U.S. 2020 Data Patch, do the following:
- Log in with an ArcGIS account and download the U.S. 2020 Data Patch.
- Unzip the USA 2020 Data Patch. The patch contains one folder containing updated dataset files, and one XML file.
- Copy and paste the patch contents to your US_2020 folder in the USA_ESRI_2020 dataset path: <install path>\ArcGIS\Business Analyst\US_2020. The image below illustrates the standard C: drive installation path.

- Delete the Business Analyst data cache, which consists of two folders located in your user profile.
C:\Users\<user name>\AppData\Local\ESRI\Business Analyst

If you do not see the AppData folder in Windows Explorer, then it is likely hidden. In the View ribbon, check the Hidden items checkbox to show hidden items.

The data cache will be recreated the next time you access data from the US_ESRI_2020 dataset in Business Analyst for ArcGIS Pro.
Once you have installed the patch and deleted the Business Analyst data cache, you will be able to follow the above steps to generate standard infographics using the Summary Reports tool, with the Business Analyst data source set to US_ESRI_2020.
These advancements were driven by your feedback and further progress towards our common goal of continually increasing workflow efficiencies. We are working on additional enhancements, so please stay tuned!

Article Discussion: