 Operations Dashboard for ArcGIS is designed to monitor day to day operations. It just comes with your ArcGIS organization and includes a Windows app that you can use to author a view of your work and stand up inside of your operations center or share across desktops and tablets throughout your organization.
You can create exciting, responsive views without any programming, that improve situational awareness, enable you to make more informed and timely decisions!
The Operations Dashboard is extremely easy to configure. So much so that in this article we are going to set up a real-time traffic camera monitoring system in just 15 minutes. The data is linked here so you can follow along. Guaranteed – you will be the GIS hero by the end of the day and you’ll discover a 1000 different ways that you can use the Operations Dashboard inside your organization!
Create your Traffic Camera Map
The Operations Dashboard uses the maps that you publish within your organization. It includes a set of widgets you can use to configure an amazing view that is targeted and purposeful and also responsive to data that is constantly changing. Let’s start by grabbing data and setting up the map.
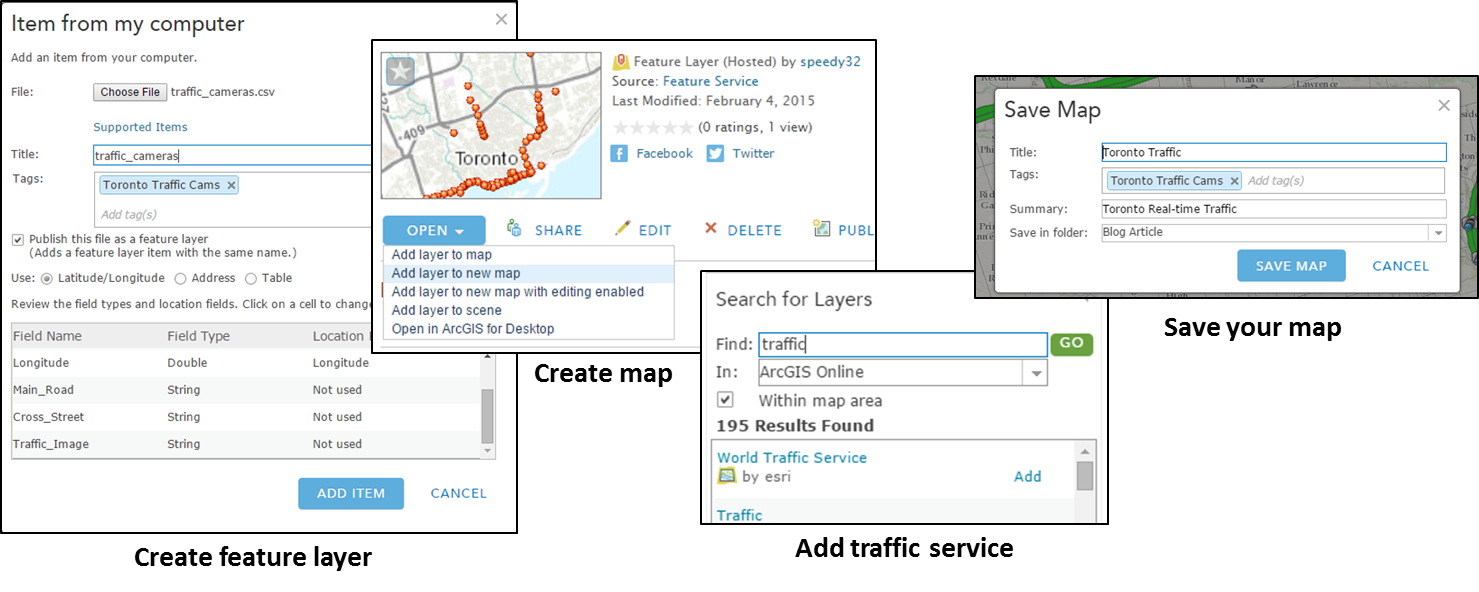
The City of Toronto in Ontario Canada has a strong Open Data initiative and provides a list of all traffic cameras that you can download as an Excel Spreadsheet. Downloading the xls, you can use Esri Maps for Office and publish a feature layer within your ArcGIS Online subscription or you can save the spreadsheet as a .CSV file and load it directly into ArcGIS Online. Note that with the Toronto traffic cameras spreadsheet there are multiple fields with the same name (Reference Static Image) so if you are following along, delete those duplicate fields first or download and start with this CSV file!
Next add more layers to the map. There are additional layers that you can download from the City of Toronto open data site or in our example just simply add the ArcGIS Online World Traffic Service to provide additional context. When finished adding layers, save your map so that you can use it as a data source for your operational view.
Create and Configure your Operation View
Now it is time to perform some magic! It is really easy to create and configure your operation views and it all starts with the map!
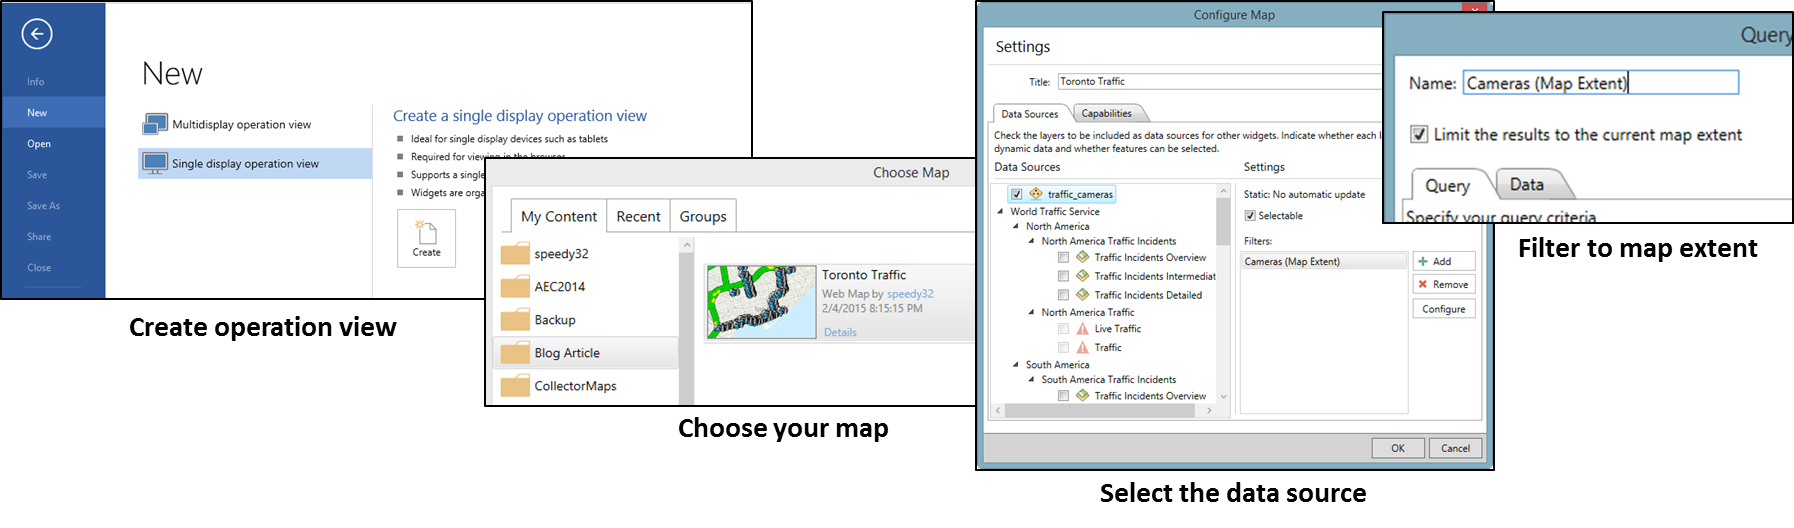
Install and start the Operations Dashboard app on your PC. You need to use the Windows app to create your operation views. When you start, create a “single display” operation view. Creating this type of view you can then share it for others to open in a browser on their PC or even use it on their iPad or Android tablet! You can then search for and choose the map you just created, and configure the map widget in your view. Within the configuration dialog you can select the traffic camera layer as a “data source”, click the check mark to make sure cameras are selectable on the map and new with 10.3 add a spatial filter for the current map extent. This spatial filter is really powerful – more about that later.
Now that we have a new view and a map, we can bring it all to life! Each of the widgets are configurable, no programming required! With the single display view we can add them into panels, create new panels, and even change their layout! What’s great is that widgets are smart! They can pass information/their state between each other! Let’s create a couple to see how…
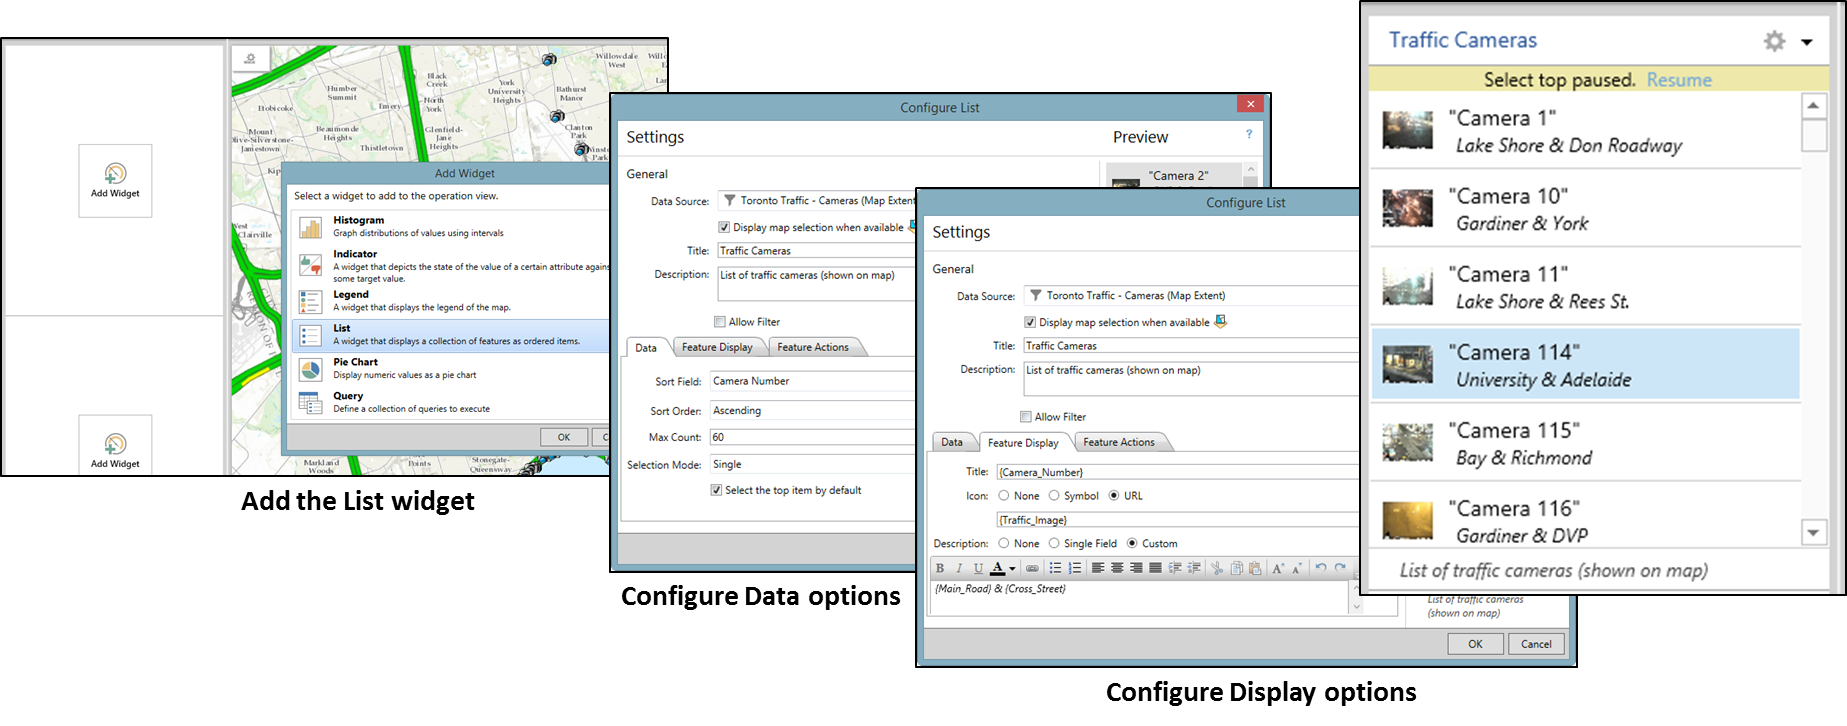
Start with adding a List Widget. We want a list of all the traffic cams and that list is going to update automatically by what’s viewable in the map (because we set the data source to do so)! With each of the widgets, you need to choose a data source. Since we applied a spatial filter, make sure to choose that filter as your data source.
Now to make this list really smart, check the Display map selection option, give it a nice name and description, in the Data tab, and check the option to select the top item by default so we can auto-populate theFeature Details widget we will add later. In the Feature Display tab you can use field values to display the title and rich text with field values for the description! Plus you can set Feature Actions to control what happens when you select or double click in the list (Zoom, Highlight, etc).
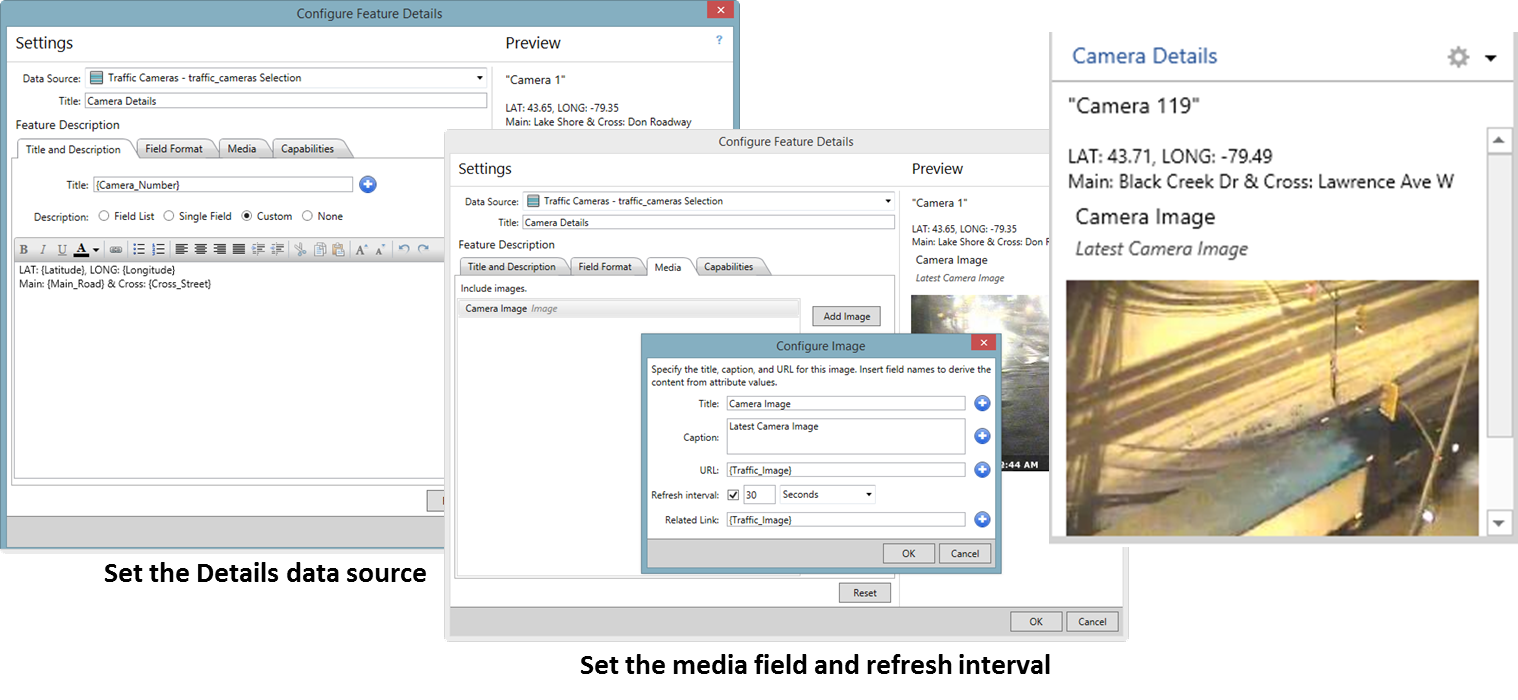
Ok, let’s add one more widget – the Feature Details widget. This widget is going to display details about a selected camera in the list (or the map) and the image from the camera is going to update on its own time interval! To do that, you need to click Add Widget on the bottom of the panel and choose the Feature Details widget from the list. Set the data source to be the selection in the list widget. This is key. Add a title and description and click on the Media tab to configure the media properties for your details widget. Here you can select the field that is the URL for the traffic camera image and new for 10.3 you can set the refresh interval for the media itself!
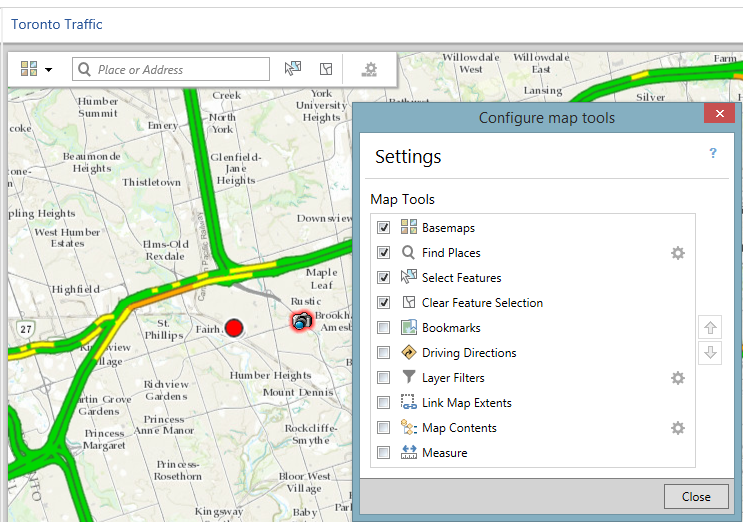
Finally let’s add some tools to the map so that not only can you select an item in the list and have it’s details show up in the feature details but we can select a camera on the map and have that in turn change the selection in the list and update the details. See how’s it’s all connected!
Click on the gear underneath your map title to add tools to the toolbar. Here you can choose what tools appear. You may want the Basemap tool, you definitely want to add the selection tool, search and the clear selection tool. You can order them on the toolbar as well.
Save and Share your Real-time Traffic Camera Dashboard
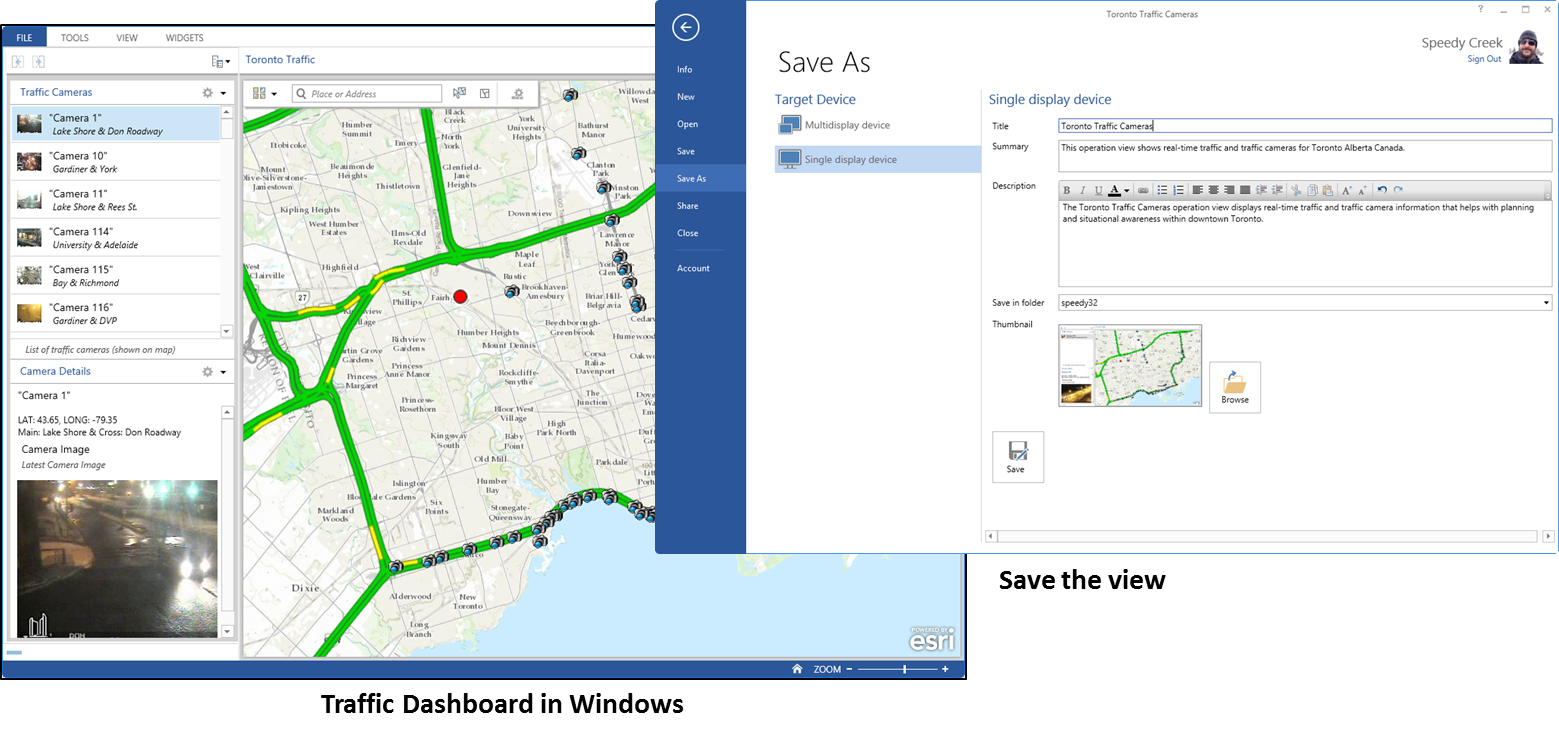
Now you have a fully functional operation view that you can save and share across your organization. From the File menu, click save or save as and provide a meaningful title, summary and description. This will create a new item in your organization that others can click on and open.
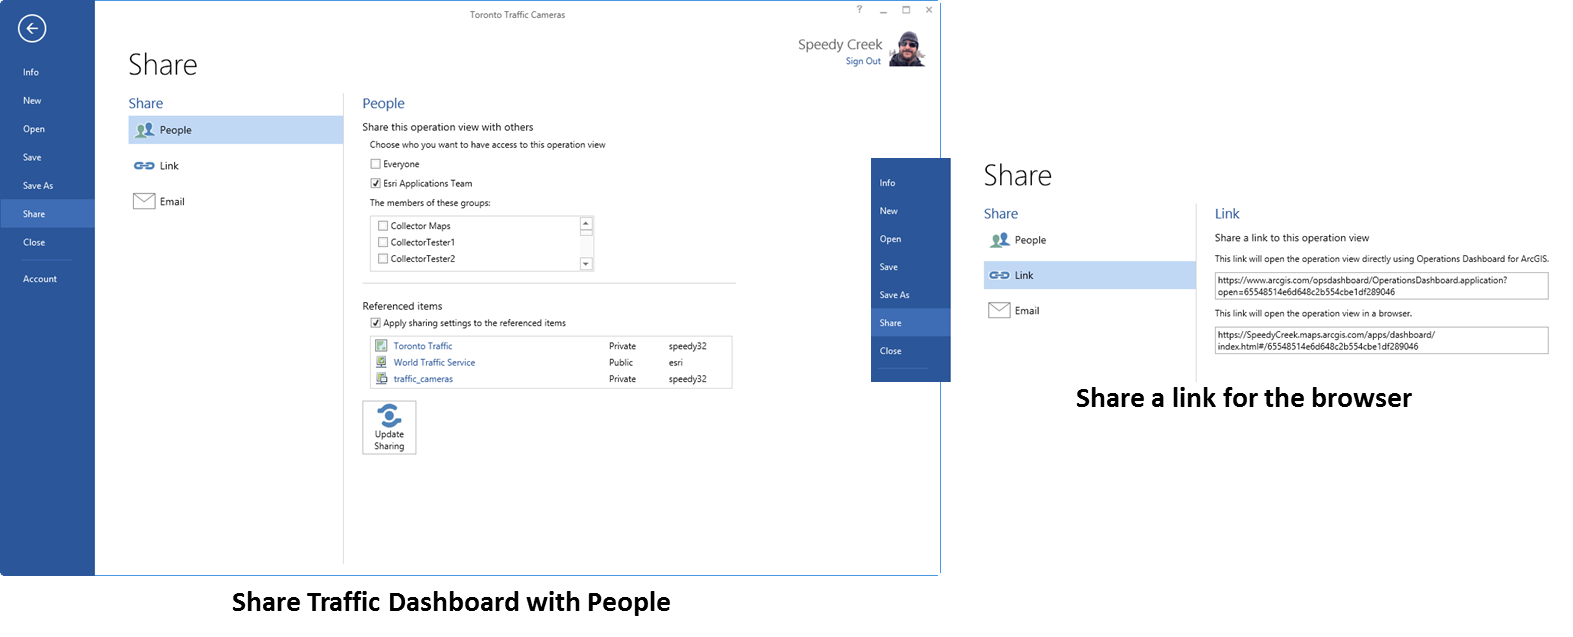
Once you save it, you can then Share it directly from within the Windows app. Again from the File menu, click Share this time and you can share with people in your organization and also share a link. The link you can either email to people or embed it in a web site.
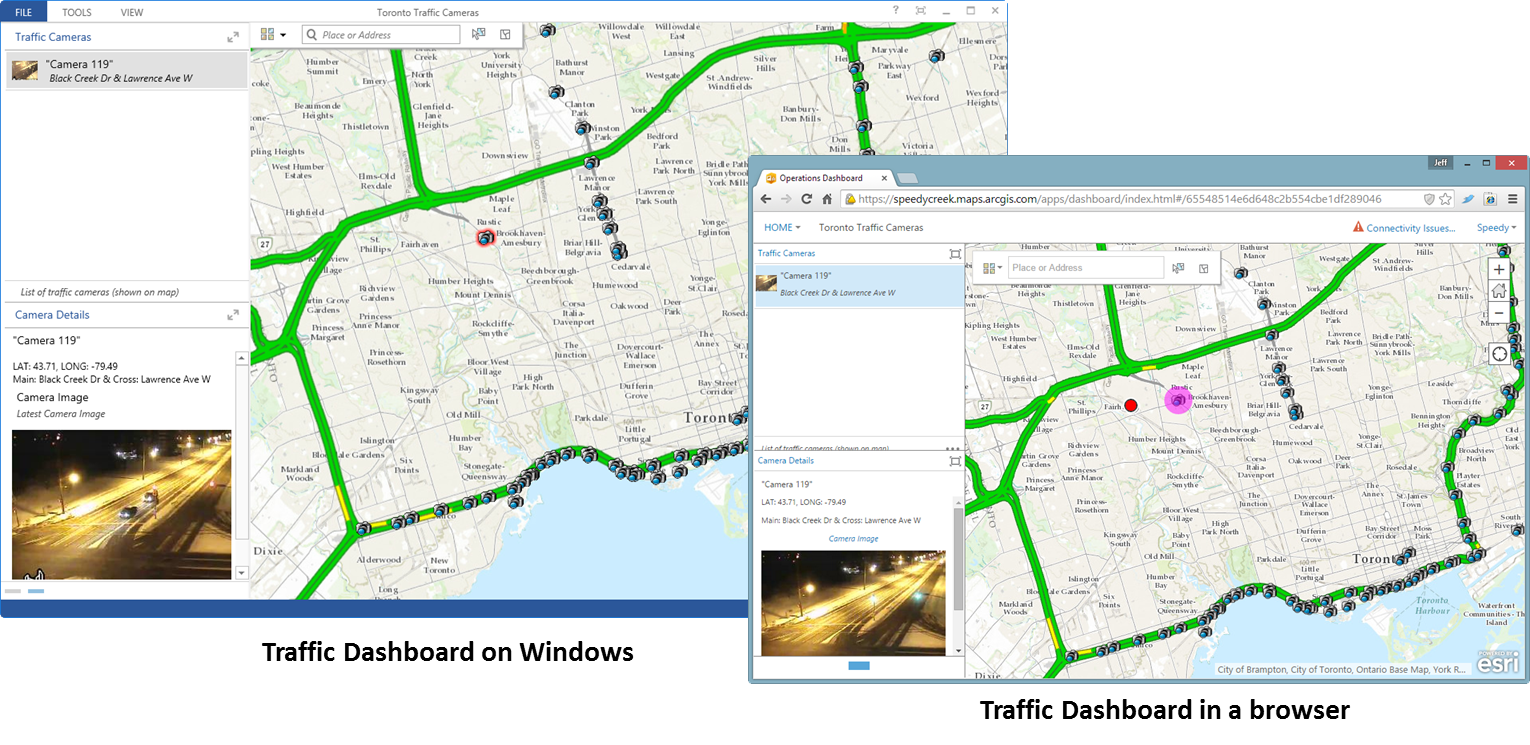
Well you are done! Three basic steps, easily done in 15 minutes and you now have a fully functional Traffic Camera Dashboard that can be opened up on a PC or in a browser on your iPad or Android tablet.
That Traffic Camera Dashboard displays a list of traffic cameras that is dynamic as you pan and zoom the map. You can select a camera in the list and have its camera image update in the details widget and you can select the camera on the map and have that selection ripple through the list and details view.
There is much more you can do with the Operations Dashboard, this is what you could do in just 15 minutes! Get started with Dashboard today and be a hero inside of your organization!

Article Discussion: