We recently updated our weighted raster overlay service toolbox on GitHub. If you recall, the tools in this toolbox help you create data that you can use for dynamic, web-based suitability modeling in GeoPlanner and Web AppBuilder.
The New Toolbox
Before we proceed with this post, you need to know what’s required to run these tools and host a suitability modeling service.
- ArcGIS Pro 2.01 or newer
- ArcGIS Enterprise 10.5 or newer
- ArcGIS Image Server
- GeoPlanner for ArcGIS license or Web AppBuilder
To download these tools, browse to Weighted Raster Overlay Service Toolbox and click Clone or Download.

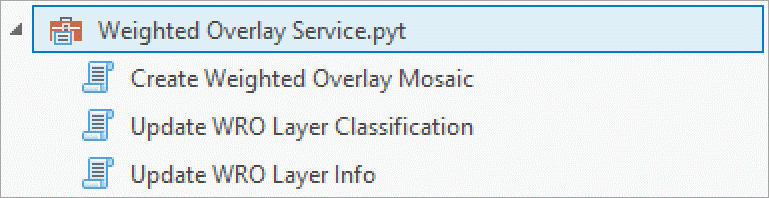
For this update, we made the tools easier to use so you can focus more on analysis and less on data conversion and preparation. There are three new tools.
We removed the old tools. If you want the previous toolbox, clone the branch wro2017 in the repo.
Here’s a quick explanation of the tools and how to use them. Before we dive in, you might want to review this comprehensive doc on how to publish a service for suitability modeling.
Create Weighted Overlay Mosaic
- Add your .tif raster layers (.tif is required) to ArcGIS Pro. Set each layer to use Classify or Unique Value Symbology. If you use Unique Value Symbology and you have more than 9 unique values, change to Classify Symbology because our brains, as puny humans, struggle to interpret more than 9 classes.
- Expand the toolbox and double-click Create Weighted Overlay Mosaic.
- Browse to a file Geodatabase.
- Type in a name for the new mosaic.
- Click Run.
You can share the output mosaic to ArcGIS Enterprise without further changes. However, you probably want to refine your mosaic using the next two tools.
Update WRO Layer Classification
This tool allows you to change classification information for any layer in your mosaic. You can also change a layer title.
- In the toolbox, double-click Update WRO Layer Classification.
- Browse to a file Geodatabase.
- Choose a layer from the WRO Mosaic Layer dropdown. These are the layers in your mosaic.
- Optionally, change your layer title. This is the layer title that will appear in the Suitability Modeler Widget in GeoPlanner and Web AppBuilder.
- Optionally, change Range Label, Min Range, Max Range, and Suitability Value for each entry in the Mosaic Layer Data section. Each entry represents a class that was read from your data by the Create Weighted Overlay Mosaic tool. Range label should be something simple, short and understandable. Examples would be Very close, Very far, Low risk, Highly densely populated. Min and Max Range specify the bounds of each class’ range. Each range is min-inclusive and max-exclusive. For a range of 0-10, all values between 0 and 10, but not including 10, are part of the range. The suitability value represents the value to which your ranges will be remapped. For example, given a range of values from 0-10, and a suitability score of 9, all dataset values from 0-10 (but not including 10) will be remapped to a 9.
- Click Run.
Remember, the things you create and modify with this tool will appear in the Suitability Modeler Widget in GeoPlanner and Web AppBuilder. Here are two graphics that show the Update WRO Layer Classification tool in ArcGIS Pro and how that layer looks in the Suitability Modeler Widget:
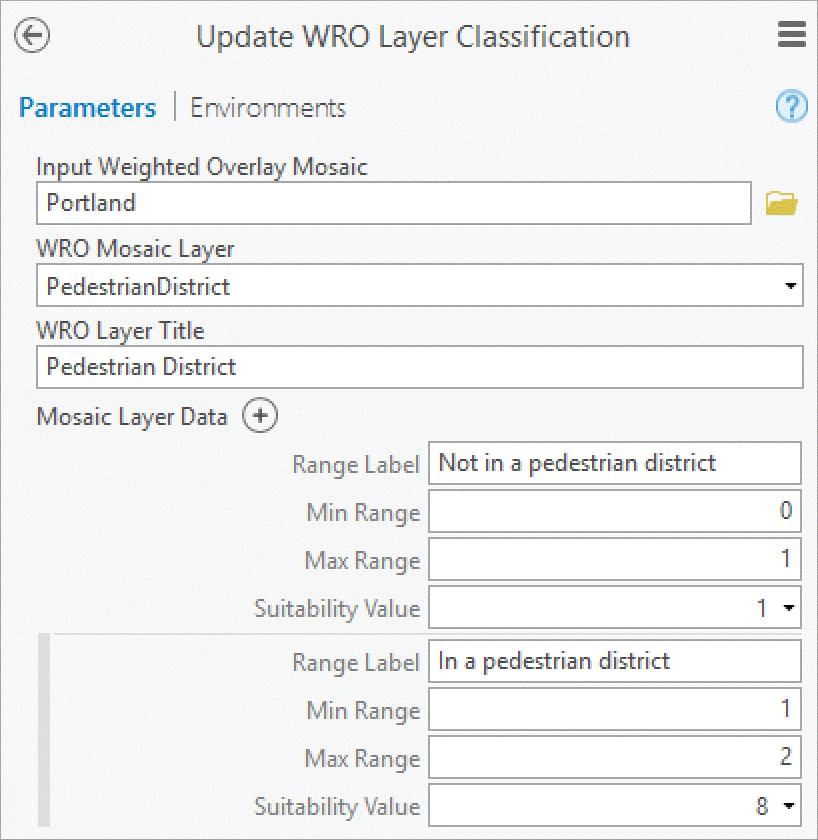
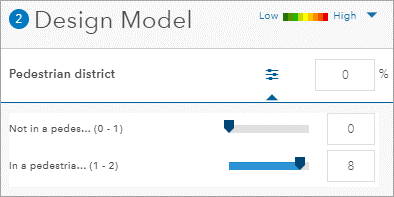
Update WRO Layer Classification tool and the Suitability Modeler Widget
Update WRO Layer Info
The third tool allows you to make some further changes to a layer in your mosaic. These changes will also be visible in the GeoPlanner and Web AppBuilder Suitability Modeler Widget.
By now, you know how to run a Geoprocessing tool, so here’s a list that describes each parameter’s functionality:
- WRO Layer Title – Allows you to modify a layer title.
- WRO Layer Description – A short description that will appear in the modeler widget when you click on a layer’s info link.
- WRO Layer Preview URL – A URL to a hosted image layer from your ArcGIS Enterprise. This will enable a small globe to appear next to a layer in the Suitability Modeler Widget. When clicked, a preview of the layer will display on the map. Click it again, and the layer will toggle off.
- WRO Layer Informational URL – A URL to a web site, PDF, or other informational site. This will override the Layer Description. When clicked, a link appears that you can right click and open in a new tab. Use this field to provide additional metadata about a layer.
- WRO Layer NoData Value – A dataset range to which you want to assign NoData.
- WRO Layer NoData Label – Label for the NoData values. The Label appears in the Suitability Modeler Widget in the design model screen.
Keep in mind
These tools control how your data will look in your GeoPlanner project or Web AppBuilder app. If your data doesn’t look correct in ArcGIS Pro, it won’t look correct on the web.
NoData values in any layer in your analysis will mask out values in any other layer when you run your weighted overlay. Here’s a simple graphic that demonstrates this:
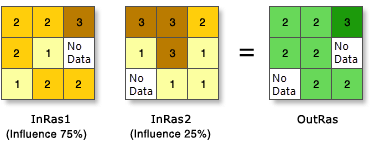
Some people like this – it’s the default behavior for our weighted overlay tools. However, other people find this to be unexpected. If you don’t like this behavior, use the Raster Calculator to calculate your NoData values to another value.
Parting Words
Want to try suitability modeling but don’t have GeoPlanner or Web AppBuilder? Sign up for the free trial by following these instructions. Click on the Don’t have an ArcGIS Online subscription link.
Commenting is not enabled for this article.