ArcGIS Field Maps is an all-in-one field app that allows you to collect observations and data from a mobile device. Field Maps is often used in the utilities and public works sectors, but educators can use Field Maps to supplement classroom lessons as well.
This Ecosystems Story uses middle school science standards to inform readers about ecosystems and the important processes that occur in them. At the end of the lesson there is an activity where readers use ArcGIS Field Maps to collect data about the ecosystems around them.
Ecosystems Story
In this blog post, I will outline how to create the observation map and form used in the activity. This process shows how Field Maps is used to create a map and form for classroom learning. Hopefully it also gives you some inspiration about how Field Maps can be used to craft activities that supplement your courses and lessons.
Let’s get started!

Step 1: Create a feature layer and map in Field Maps
First, let’s build a feature layer and map in the Field Maps web app.
Navigate to https://www.arcgis.com/apps/fieldmaps/ and sign into your ArcGIS account. On the Maps page click + New Map.
Input a name for the map layer. In this example, I will name the layer Ecosystem Observation. Select Point layer as the layer type.
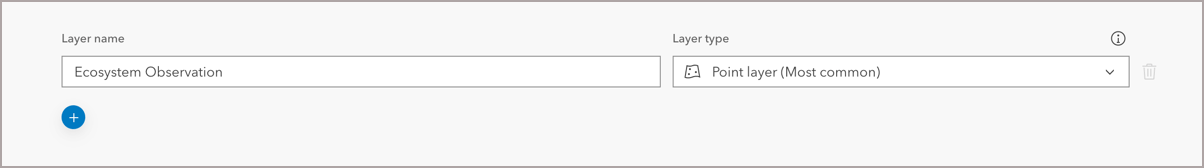
Click Next on the layer settings page.
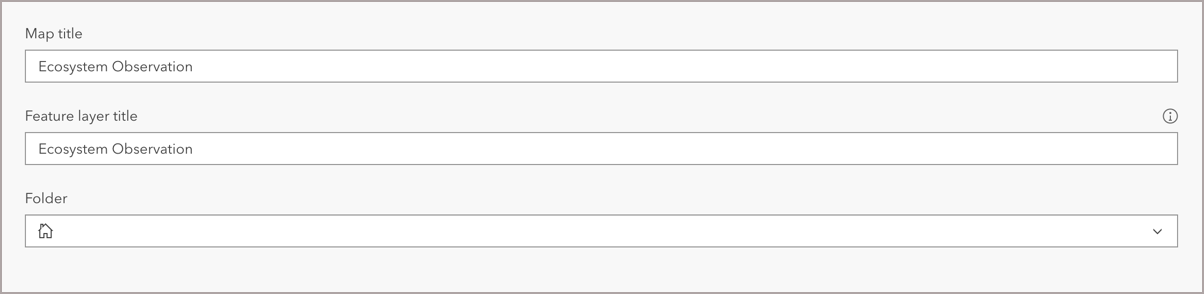
On the Title and save page, add a name for the map, input a feature service title and choose the folder the map will live in.
It should look something like this when completed:
Click Create map to save your layer settings and create your map. Once the map is created, the Forms tab opens where users can begin configuring the form used for data collection.

Step 2: Build the ecosystem observation form
Next, let’s create the form students will use to collect information about the ecosystems in their area. First, we will add a Student name field that students will use to input their name.
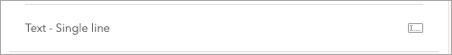
From the form elements list, drag and drop the Text – Single line element onto the form canvas.
For display name, type Student Name.
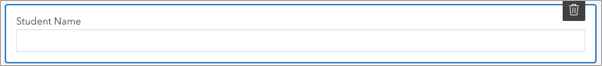
Select the Student Name element to deselect it.
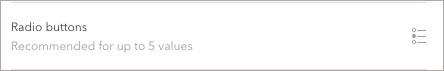
Next, let’s add a Radio button choice element to our form by dragging and dropping the radio button element onto the form canvas.
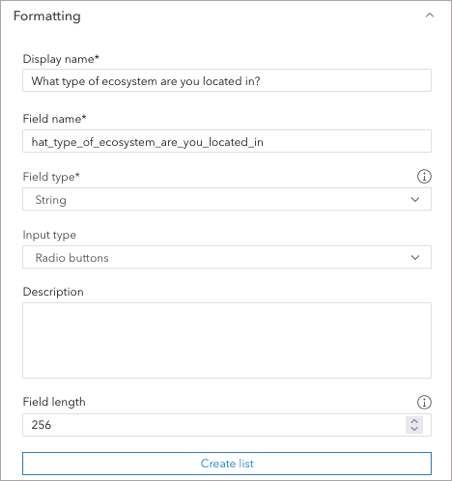
For display name, type What type of ecosystem are you located in?. Select String from the Field type drop down menu. Next, select Create list to add a list of choices for this question.
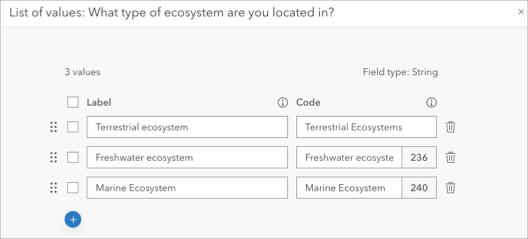
Add the following choices to the list of values and then click Done:
- Terrestrial ecosystem
- Freshwater ecosystem
- Marine ecosystem
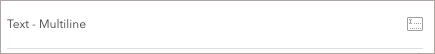
Next, we will add a few open response questions where students can record their notes and observations. From the form elements list, drag and drop the Text – Multiline element onto the form canvas.
For Display name type What is the temperature and weather like in your environment?.
Add a Text – Multiline element and complete the same steps for the following questions:
- What abiotic factors do you see?
- What biotic factors do you see
- Do you see any sign of ecosystem disruption? If so, what?
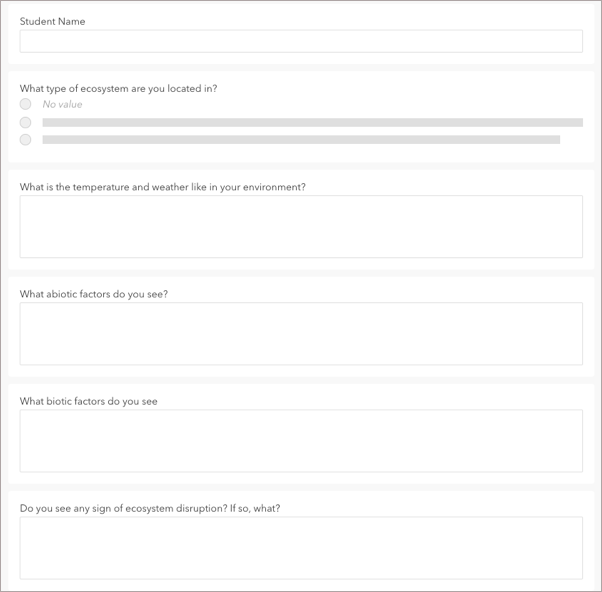
Your form should look something like this when complete:
Optionally, we can add descriptions to a few of our form elements. Description text provides contextual information about the purpose of a form element.
For example, select the What abiotic factors do you see form element?.
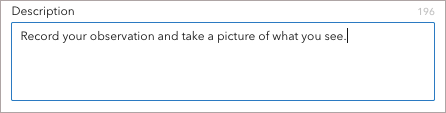
In the Properties pane, add the following sentence to the Description box: Record your observation and take a picture of what you see.
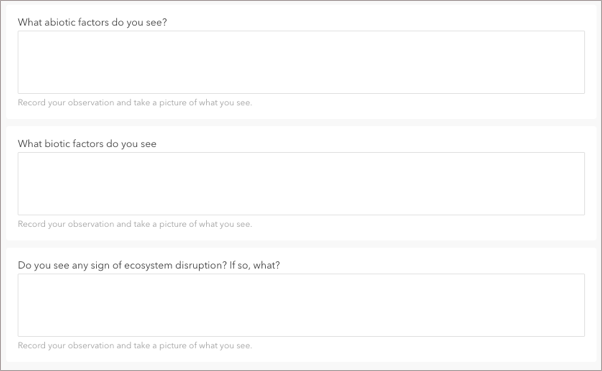
Add the same description text to the following elements:
- What biotic factors do you see
- Do you see any sign of ecosystem disruption? If so, what

Step 3: Share the map and form with students
Finally, we will share the map with students so they can access it and use it to record observations in their area.
In the left panel, click the  Sharing tab. Next, click the blue Set sharing level button and select the sharing level that will give your students access to the map and form.

Click Save.
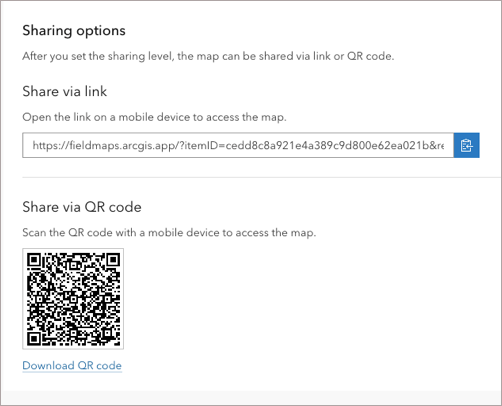
Under Sharing options, Field Maps generates a link and QR code students can click on or capture to access the map on their mobile device. Embed the map link and QR code into your Story to make it readily accessible to your students.
This was a general outline of how to create an ecosystem observation map and form in Field Maps. Feel free to use this workflow in your own science curriculum or employ similar techniques in an activity that fits your lessons.


Article Discussion: