ArcGIS Insights has teamed up with Snowflake
Snowflake is a leading cloud computing – based data warehouse that can store geospatial data. It supports deployments on Azure, AWS, and Google Cloud and offers a data warehouse product designed to run exclusively in the cloud, providing flexible options in the size, deployment, and performance of its warehouses. Snowflake provides a structured view into all of the data an organization generates and makes it available for further analysis downstream.
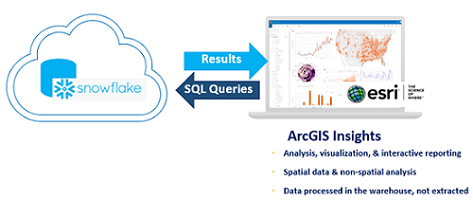
ArcGIS Insights, a visual analytical environment with first-rate spatial analytic capabilities, has an embedded connector to Snowflake that allows users to work directly with data stored in a warehouse, without copying out the data, meaning that it works at the speed of the warehouse to which it is connected.
Analysts, data scientists, and data professionals can use ArcGIS Insights as a visual analytics environment for numeric, textual, and temporal data with the added advantage of working with spatial data with all the relevant functionality necessary to process, analyze, and display spatial data precisely and accurately.

Digital transformation leads companies to discover geospatial data
Many enterprises are investing in digital transformations, looking for a single source of truth their organizations can use to answer questions regarding business operations and opportunities.
As various internal data sources are combined into one cohesive whole, a company often discovers that they store and maintain geospatial data. Data professionals are discovering the value of place or location as a new aspect to their insights. Stored as text, JSON, or in a spatial type, geospatial data adds a new dimension to the information that can be drawn from business data.
Looking at multiple characteristics of data from the perspective of its location often answers “why” questions. As in “Why is the membership to a bank branch more or less engaged based on drive times to the location?” or “Why does one branch of a retail store sell more of a specific item than another branch?

Esri as a leader of geospatial analytics has a product for analysts
Esri has been a leader in GIS, or geographic information systems for over 50 years. The company offers an extensive suite of software products that enable creation, management, analysis, and usage of geospatial data.
One of the products in its arsenal is ArcGIS Insights.

ArcGIS Insights facilitates exploratory analysis, modeling and reporting of spatial, statistical, and temporal analysis, through a visually interactive environment. Cloud-native data warehouse users can forego writing SQL queries to process their data and take advantage of the in-database processing that, ArcGIS Insights offers for any type of data.
The user experience is driven by the characteristics of the data, meaning that the tool choices available to the user are based on the characteristics of the data itself, empowering analysts of all levels to perform the most relevant analysis to their work.

An aspect of ArcGIS Insights that sets it apart from other visual analytics tools in the market is its ability to simplify spatial analytics. No matter how geospatial data is represented, as text or as a spatial type, and no matter what spatial projection it comes in, ArcGIS Insights can work with any format and any projection of spatial data, giving the analyst a spatially savvy environment without concerns about preserving the accuracy and precision of the analysis.
Want to learn more? Check out the Insights web page for a free trial, training resources, and to learn what others are doing. This 15-minute video gives an overview of ArcGIS Insights in action. Contact us if you have any questions or feedback .

Article Discussion: