Give your entire organization the ability to make spatially intelligent decisions. During this UC, find out how your stakeholders can visualize and analyze ArcGIS and business data together in one place, as well as spatially enable tabular data with easy to use ArcGIS tools. Stop by the Location Analytics expo area or attend an array of live demos and sessions that will introduce you to ArcGIS offerings that work natively with Microsoft products and provide intuitive, non-disruptive location analytics.
Ready to bring GIS to all divisions analyzing and reporting on data? Here’s your UC 2019 resource guide:
ArcGIS apps within Microsoft products
Deliver GIS to stakeholders where they are, in the products they use every day. During the Esri UC learn how ArcGIS integrates with Microsoft Office, Microsoft Power BI, and Microsoft SharePoint.
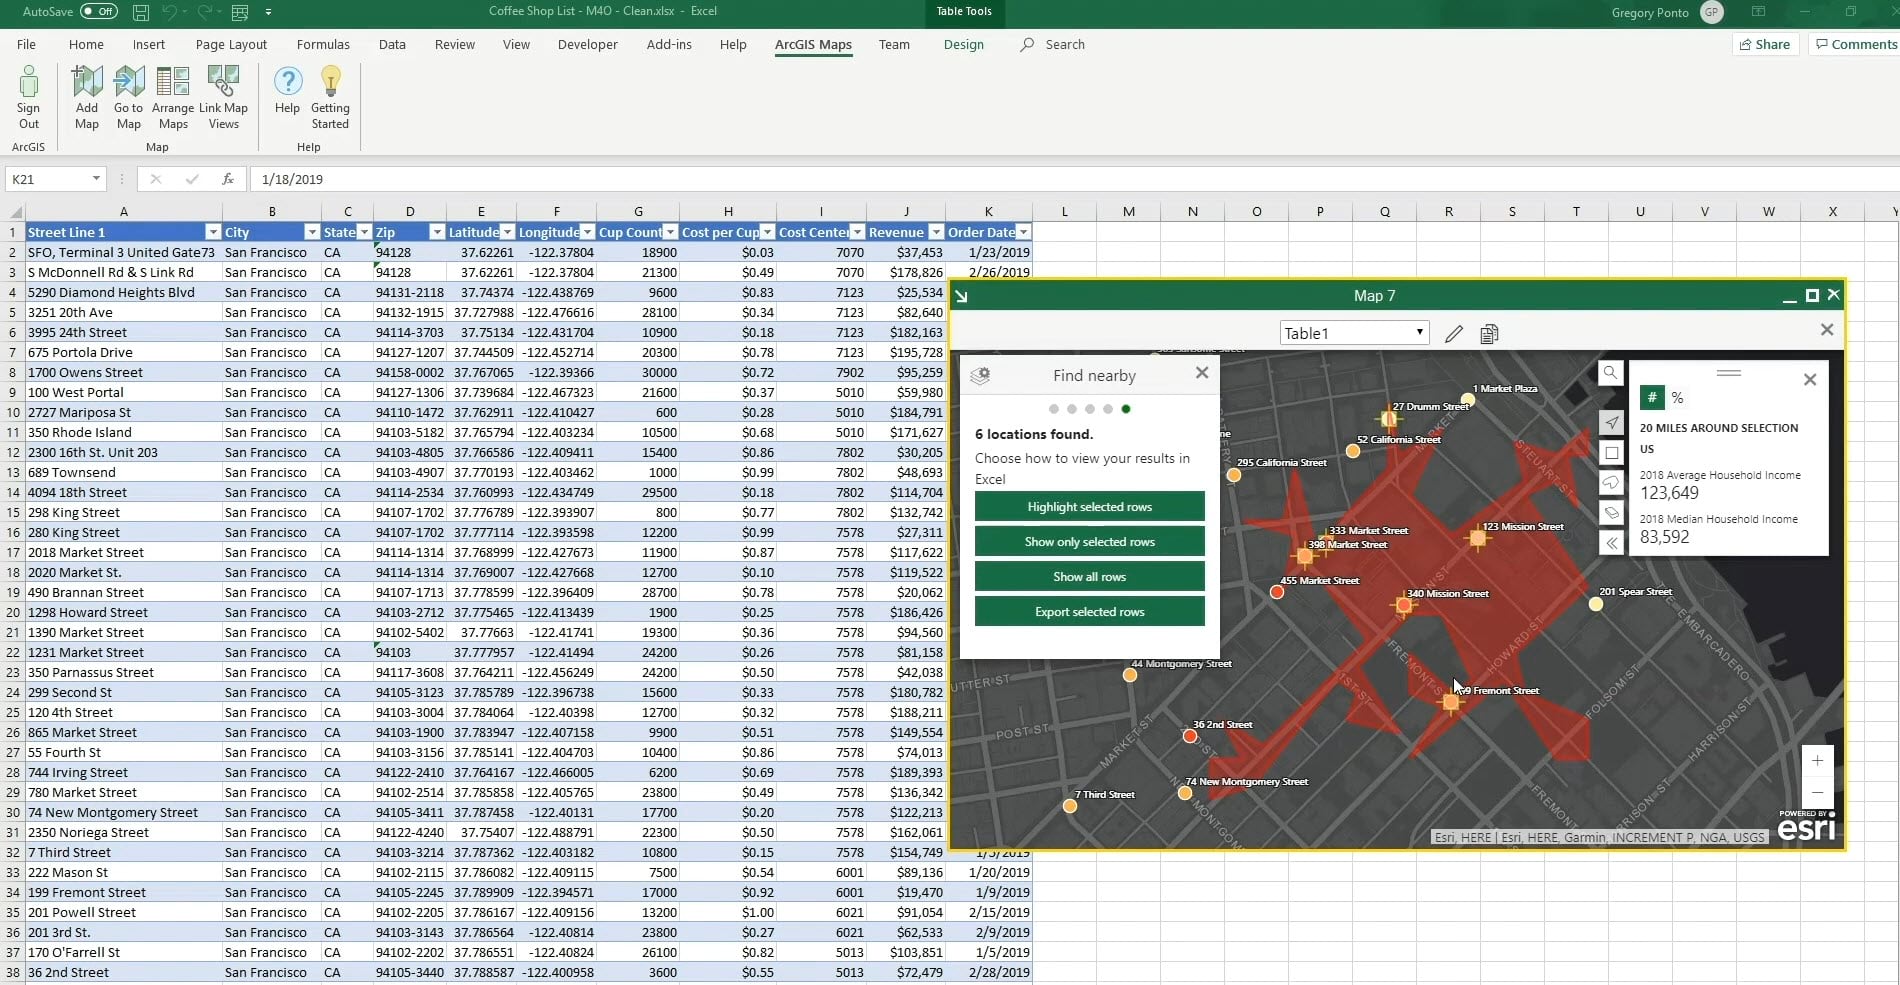
ArcGIS Maps for Microsoft Office: An Introduction
Tuesday, July 09 | 2:30 pm – 3:30 pm | SDCC – Room 08
ArcGIS Maps for Office puts Microsoft Excel data in context of location. See patterns and relationships to better understand a situation and make smarter decisions. Then, use Microsoft PowerPoint to share the results. This workshop will demonstrate the value of the product using several use case scenarios as well as key new features of the latest releases.
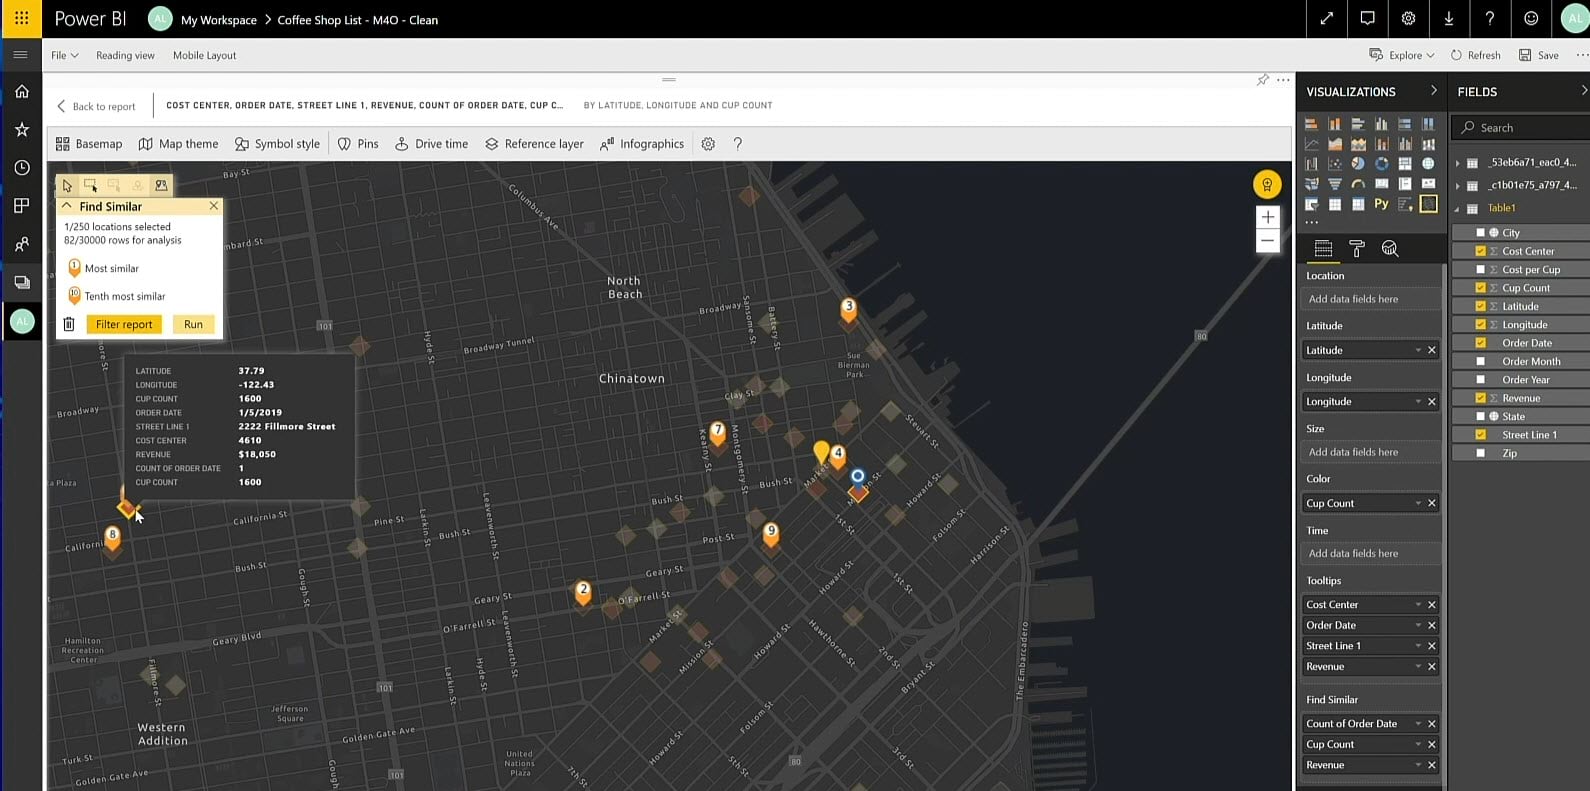
ArcGIS Maps for Microsoft Power BI: An Introduction
Tuesday, July 09 | 10:00 am – 11:00 am | SDCC – Room 14 B
ArcGIS Maps for Power BI, available inside Microsoft Power BI, allows users to create beautiful map visualizations that surface patterns and trends in their data. Users can quickly create dynamic, interactive maps using Power BI data to start exploring patterns in a whole new way. This workshop will demonstrate the value of the product using several use case scenarios as well as key new features of the latest releases.
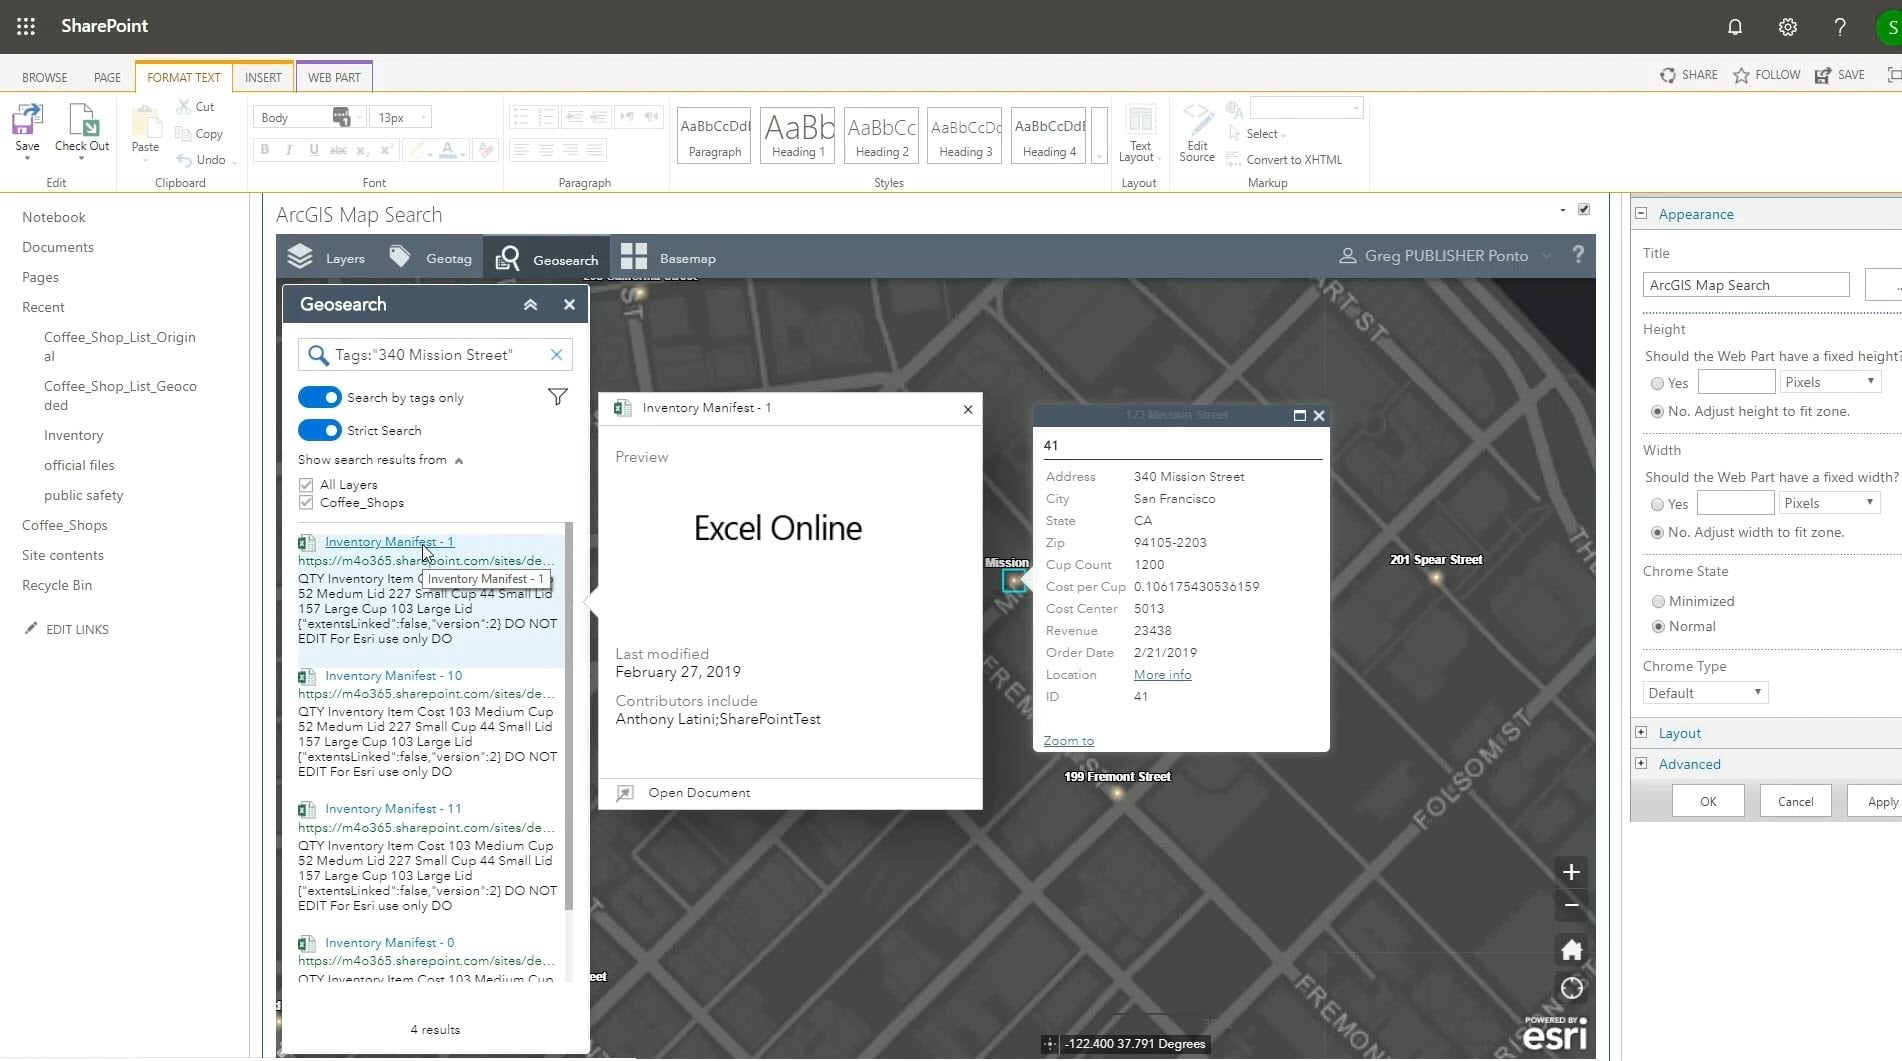
ArcGIS Maps for SharePoint: An Introduction
Tuesday, July 09 | 1:00 pm – 2:00 pm | SDCC – Room 14 B
ArcGIS Maps for SharePoint is an app that allows you to map and search content in Microsoft SharePoint. Visualize data on ArcGIS maps. Use ArcGIS tools to manage and analyze for deeper understanding and better decision-making. Enhance data and maps with ready-to-use geographic content from ArcGIS. Then, share the maps created with a set of interactive and configurable mapping components for use with existing Microsoft SharePoint sites. This workshop will demonstrate the value of the product using several use case scenarios as well as key new features of the latest releases.
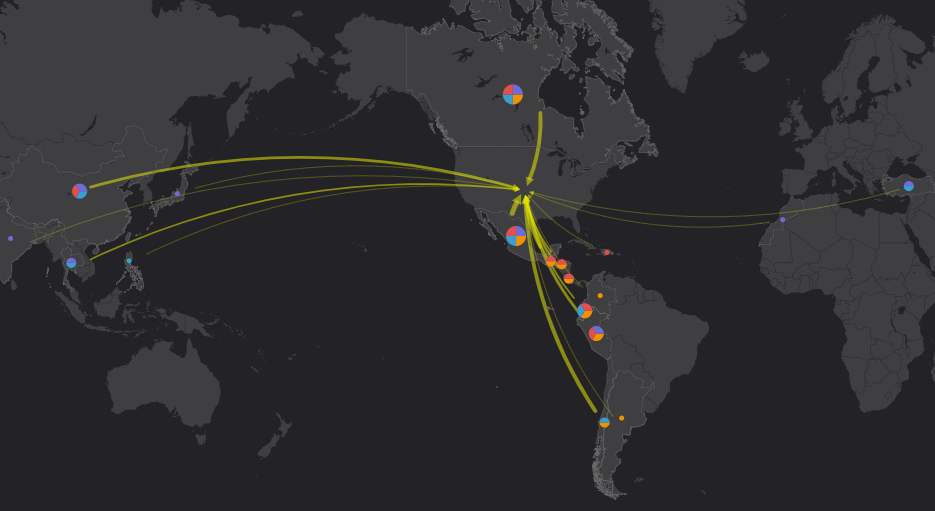
Analytics That Goes Beyond Points on a Map
It’s not about what you see, it’s about what you can do with a map. Empower stakeholders to dive deeper with location analytics to discover, quantify, and predict trends and patterns that improve business outcomes. Allow them to discover new insights such as, “What’s nearby?”, “How is it related?”, “How has it changed?” and more with Insights for ArcGIS.
Insights for ArcGIS: An Introduction
Insights for ArcGIS is available as part of ArcGIS Enterprise and Online and provides a new user experience for analysis that focuses on simpler ways to work with your data and share results including visualization, drag and drop analytics, and on-the-fly filtering and aggregations making interactive and exploratory analysis fast and intuitive. You will learn how to get started with Insights for ArcGIS, including adding data from numerous sources, exploring some of the available analyses, and seeing how to share results and models, as we work through some analysis examples.
Tuesday, July 09 | 10:00 am – 11:00 am | SDCC – Ballroom 06 B
Wednesday, July 10 | 10:00 am – 11:00 am | SDCC – Room 01 A/B
Friday, July 12 | 9:00 am – 10:00 am | SDCC – Room 04
Insights for ArcGIS: Data Visualization, Analysis and Science
This session will demonstrate some of the more advanced visualizations available in Insights, describing how you can interpret the results they give you. We will outline some of the more advanced analysis available, such as regression and link analysis. Additionally, we will cover how Python and R provide modules can be used to enable Insights with data science capabilities.
Tuesday, July 09 | 10:00 am – 11:00 am | SDCC – Ballroom 06 A
Wednesday, July 10 | 1:00 pm – 2:00 pm | SDCC – Room 01 A/B
Friday, July 12 | 9:00 am – 10:00 am | SDCC – Room 03
Insights for ArcGIS: Best Practices
Insights for ArcGIS allows analysts, casual to advanced alike, to study all aspects of their data – temporal, qualitative, quantitative and spatial. This workshop will outline some of the key principles that Insights for ArcGIS observes, and we will demonstrate some of the less obvious tips and tricks you can use to get the most out of your data.
Wednesday, July 10 | 8:30 am – 9:30 am | SDCC – Room 10
Wednesday, July 10 | 4:00 pm – 5:00 pm | SDCC – Room 32 A/B
Get Up and Running with Insights for ArcGIS
With Insights for ArcGIS you can analyze and tell your story in many ways by exploring and visualizing spatial and non-spatial data. This presentation will introduce users to getting started, highlight best practices and provide tips and tricks to troubleshoot Insights so you can present your work in no time!
Wednesday, July 10 | 10:00 am – 10:45 am | SDCC – Expo Demo Theater 06
Location Analytics in Practice
Hear straight from the ArcGIS location analytics community. Attend an event and sessions that will walk you through how location analytics is being put into real-world practice.
Join us for lunch and discussions during the Insights for ArcGIS SIG. Come see how organizations are realizing the value of Insights for ArcGIS within government, the private sector, and non-profit. Hear from Pinal County Public Health, Aegean Energy Group, and Direct Relief. We’ll also talk about the future of Insights and what’s coming.
Tuesday, July 09 | 11:30 am – 12:30 pm | SDCC – Room 10

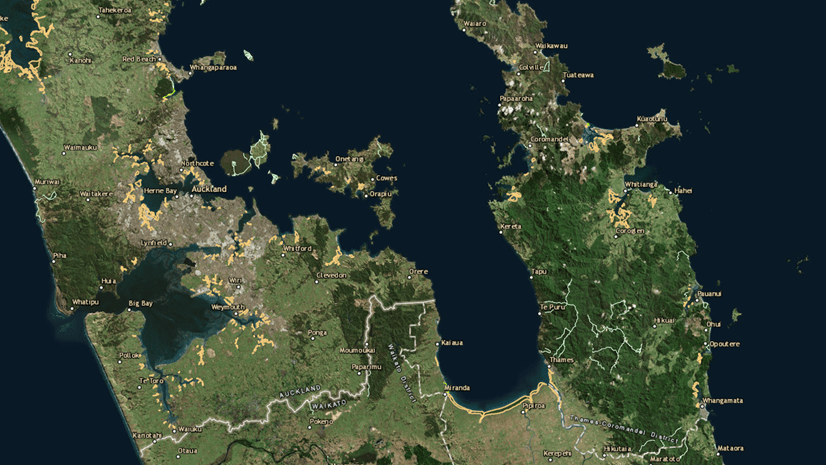
Insights for ArcGIS Informs Conservation and Restoration in the Chesapeake
Learn how Chesapeake Conservancy organizations are using Insights for ArcGIS, big data and 3D landscape visualization for their various conservation and restoration initiatives.
Tuesday, July 09 | 10:00 am – 11:00 am | SDCC – Room 29 A
Streamlining Big Data with Insights for ArcGIS
In this session you will learn how Insights for ArcGIS is being used to perform analysis on water quality data and machine generated data of factors impacting sanitary sewer overflows. Find out how Insights is used to visualize patterns and trends in seconds instead of hours and enables sharing of results as web services making analysis easily available to staff.
Tuesday, July 09 | 10:00 am – 11:00 am | SDCC – Room 29 B

We look forward to chatting with you in sunny San Diego! Don’t forget your sunscreen. =)


Commenting is not enabled for this article.