At a time where the whole world has become familiar with charts, flattening curves and R0 values; our ArcGIS Insights application is helping people understand patterns and trends within COVID-19 related data. Using Insights, we can explore and analyze historical data, perform statistical evaluation and make data-driven predictions.
However, this coronavirus pandemic has also brought “stay-at-home” restrictions to many of us and impacted our work-life situations. Social media and playing games and quizzes with our friends has become an important yet fun way to stay in touch and keep our brains active.

So, naturally, we decided to produce one of these typical quiz types in Insights.
We took images of famous cartoon and other TV and film characters from around the world and generalized each of them to stacked blocks of color. By assigning each character in a group a letter (A, B, C, and so on) – as we didn’t want to give their character names away – we were able to produce data categories or columns.
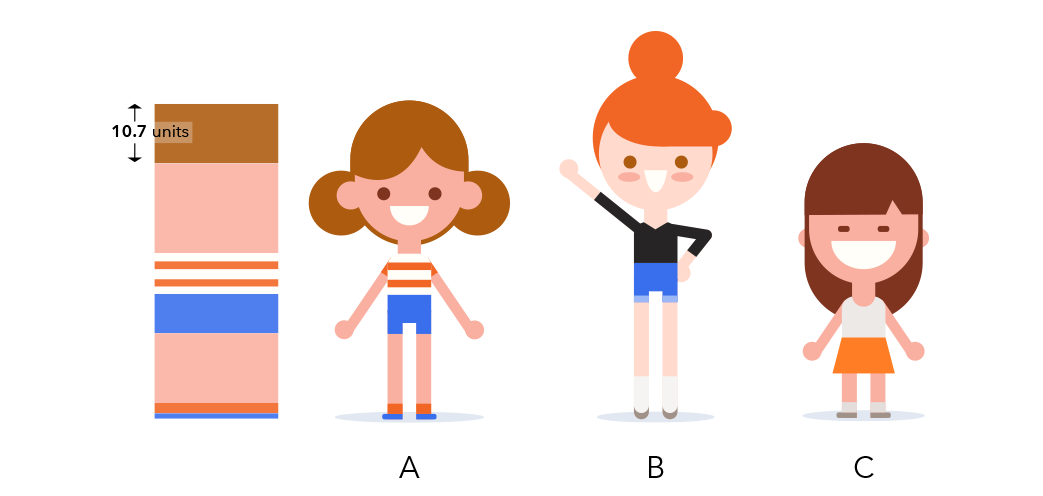
By measuring the height of each block, we were able to assign values to each column. We also made a note of the color of each block.

We added these data tables into Insights, then dragged and dropped the Column and Value fields from each table to the page, choosing Stacked Column Chart to create a chart for each quiz question. All that was left was to apply the correct color values and add answers to the back of each card.
Finally, we shared our workbook as a public application so that you can play the quiz too.
Good luck!
Quiz: Cartoon, comic, film and television characters

How i become a member of the illuminati. my name is Destiny Brown,it has always be my dreams of becoming a member of the great illuminati.i went to the internet for research,i saw many testimonies on the internet,i said let me give a trier because i lost my job for the past 8 months and life has been so miserable for me and my family due to financial stability,because i have been scams for so many time but i never give up,not on till i meant the right source i will never give up,to my greatest surprise i saw a testimony of a man called Garry Raymond he was also a victim of been scam and he said how he become a full member without paying any money i picked up the number and message him on whatsapp +13019692020 and he gave me the guild lines am to follow before i will be accepted and i follow the rules as i was told i have to partake in the initiation ceremony before becoming a member so i did it,Surprisingly 48 hours after i was initiated, I receive a call from the head quarter that i have been fully initiated that all my benefit will be given to me as a new member,the sum of$2,000,000 us dollars to start a life and dream car of my choice and house of my choice many others.i have been in this group for the past five years now and the lord gram master appointed me as one of the agent am glad and happy with my family with joy and happiness. So if you are interested to be a member of the great illuminati you can email the illuminati chamber (illuminatiwordoffame12@gmail.com) or call and text whatsapp this number +13019692020 anyone who wants to join it is free to join.