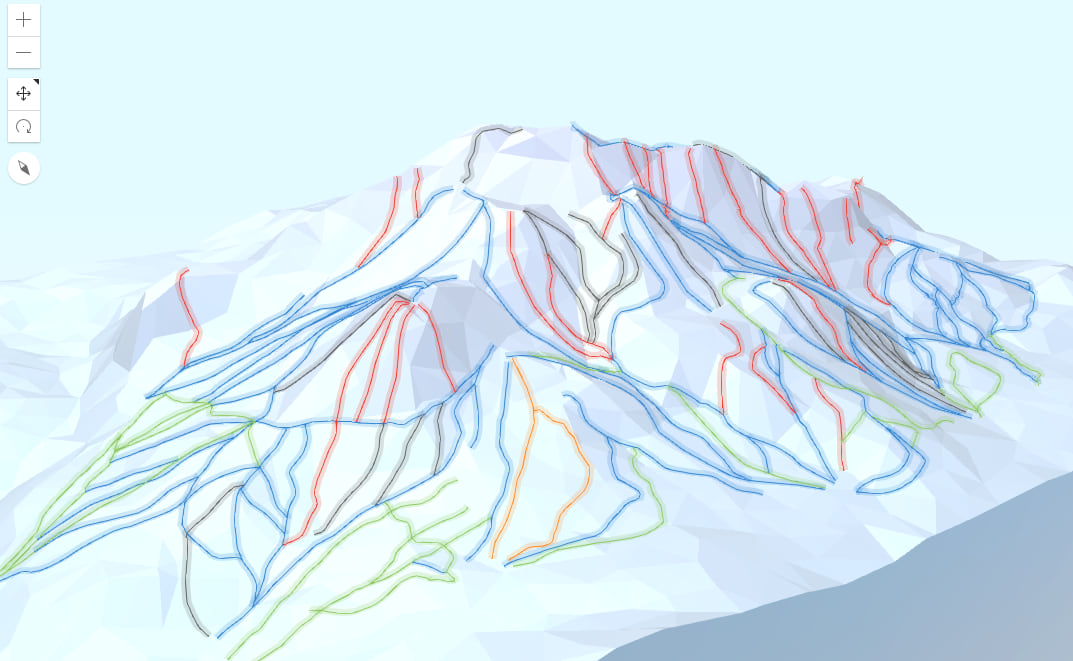
In the previous blog post Arno showed you how to create a low poly terrain surface for the map. In this post we’ll add the thematic data (e.g. ski slopes, ski lifts, points of interest, trees) and we’ll look at some tips and tricks in terms of symbology.
Align thematic data to the mesh surface
The data is stored in FeatureLayers that we’ll add to the scene. However, the features don’t contain z values, so our first step is to align them to the mesh surface. Currently, we can’t align features to mesh geometry using the elevationInfo property. Instead we’ll use the meshUtils.createElevationSampler() method to create an ElevationSampler from the mesh geometry. This sampler can then be used to enhance features with z values based on the mesh elevation at the location of the feature.
meshUtils.createElevationSampler(mesh)
  .then(function(sampler) {
    // query the features that don't have
    // elevation information
    layer.queryFeatures({
        where: "1=1",
        outFields: ["OBJECTID"],
        returnGeometry: true,
        returnZ: true
      })
      .then(function (result) {

        const features = result.features;
        // enhance each feature with z values
        // retrieved from the sampler
        features.forEach(function (feature) {
          const zGeometry = sampler.queryElevation(feature.geometry);
          feature.geometry = zGeometry;
        });

        // overwrite the geometry on the layer
        layer
          .applyEdits({ updateFeatures: features })
          .then(function (results) {
            console.log(results);
          })
          .catch(console.error);
      });
  });
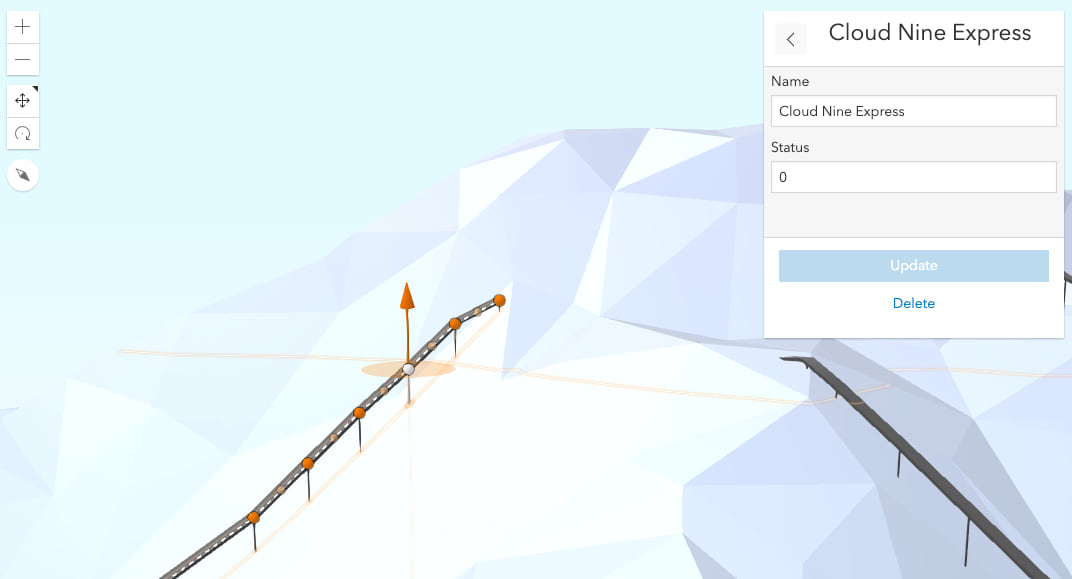
At the end, we can make small changes using the Editor widget. For example, the ski lifts need adjustments for a more realistic alignment to the terrain.
Create symbols for ski lifts using 3D strips and cylinders
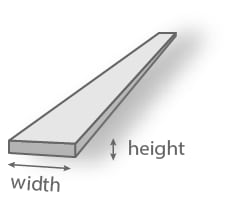
For the ski lifts we used a PathSymbol3DLayer with a square profile where the width is larger than the height:
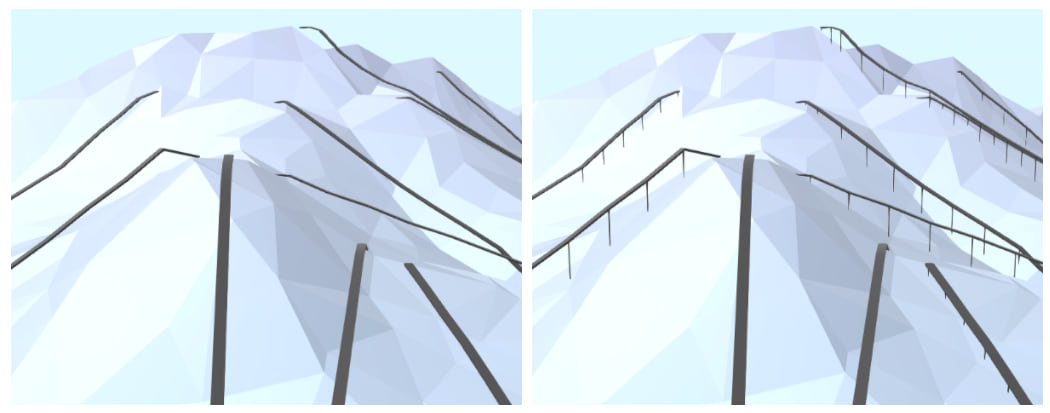
Using a dark gray color for the path helps to identify them as ski lifts on the map, but it still feels a bit too abstract. So we decided to add pillars, similar to real ski lifts. To add them we created a new GraphicsLayer with points extracted from the vertices of the ski lift lines. The layer uses a SimpleRenderer with cylinder symbols:
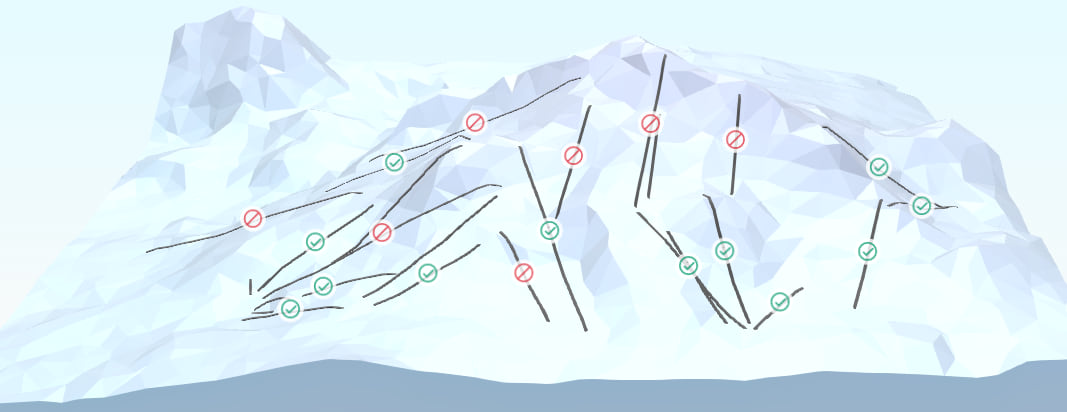
Use icons as labels to show ski lift status
To show whether a ski lift is open or closed we could use a different color for the lines based on the status (red for closed lifts and green for open ones). However, the dark gray color is what makes the lift symbols easy to distinguish on the map. And we want to add a small identifier, not something that could distract our viewers. So we’re going to add a label for each lift. Having a text could be too verbose, so we’re going to use icon labels from the Esri Icon Font.
On GitHub you can see the code for adding multiple label classes using an icon font.
Two line symbol layers for ski slope symbols
Multiple line symbol layers can be combined within one symbol. We are going to use this feature to emphasize the ski slopes.
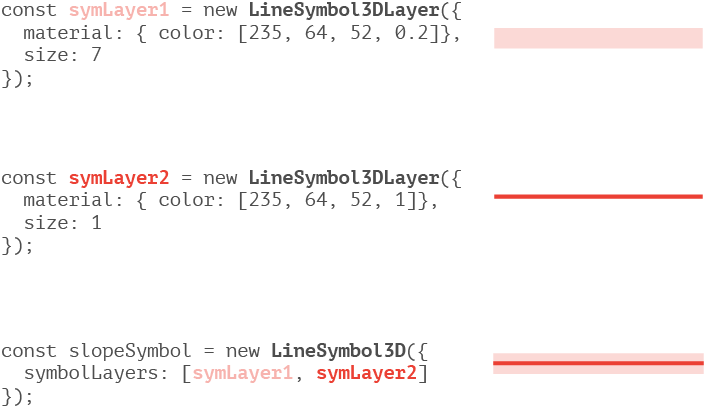
The first symbol layer has 0.2 transparency which will allow the terrain to show through. The line is quite wide, so it creates a halo effect.
The second symbol layer uses a fully opaque line, using the same color. This time the line is much thinner, so that it doesn’t attract too much attention. In the end both layers are combined in a LineSymbol3D. Using a UniqueValueRenderer we create different such symbols for each slope category:
Symbolize huts with a 3D model
The huts in our map are just points in a FeatureLayer. These points can be symbolized with ObjectSymbol3DLayers that can reference any custom 3D model. In our map, we want to show the restaurants and hotels in the ski resort with a 3D model of a hut. 3D artists post some of their work under a Creative Commons license on websites like Poly or Sketchfab. If your 3D modelling skills are very limited or nonexistent, you can search for a model that fits your map on one of these websites. For the hut I downloaded this 3D model of a chalet:
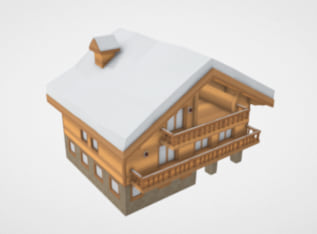
Custom 3D models can be added as a resource for the ObjectSymbol3DLayer if they are in glTF format.
When you add a 3D model as a symbol, the size and the rotation of the model might not fit to your scene. In our case, each hut will need a symbol with a different size and orientation. To solve this, we added size and rotation fields on the layer and used them as size and rotation visual variables on the renderer. Like this, the renderer uses the values in the fields for symbol scaling and orientation. If we enable editing capabilities on the layer and we add the Editor widget to the scene, we can set these values interactively as you can see in the video below:
Use more than one icon for a symbol
Points of interest in a ski resort can have multiple facilities (restaurant, bar, toilets, etc.), and we want to use multiple icons to show which facilities are available at each point. To achieve this we’ll use multiple symbol layers and set an offset from the original position of the symbol layer. The graphic below displays an example with two icons: one for restaurant and one for first aid kit. We placed the restaurant icon relative to its initial position (the black circle) by moving it 50% of its width to the left and 50% of its height to the top.
You might notice that we actually have three symbol layers because we also added a symbol layer for the background. The background is a semi-transparent white square, generated using the Canvas API. You can find the code for generating the background on Github.
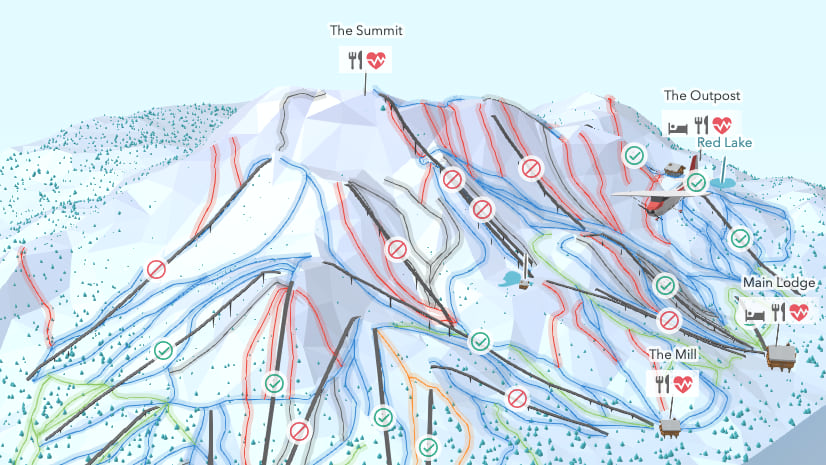
These are the main features that we used to create this ski resort map. We hope you enjoyed this blog post and we’d love to hear how you use these features! In the meantime, you can explore the map here and if you’re interested in the details, check out the code on Github.


Article Discussion: