A big update to the ArcGIS API for JavaScript was just released today. Version 4.9 packs a punch with the new FeatureForm widget for attribute editing, drawing enhancements to include geometry reshaping, broader WebGL support, 2D and 3D navigation using game controllers, and much more. Read on to learn more about some of the new capabilities and improvements.
The road to full editing support in 4.x: Attribute editing and add/remove vertices
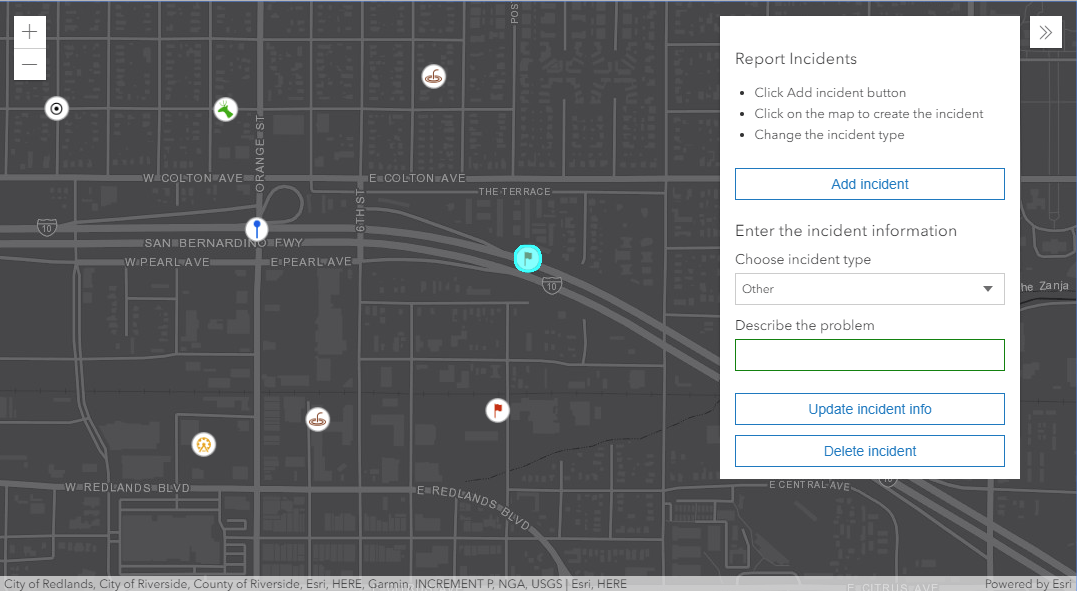
FeatureForm widget (beta). Allowing users to view and edit feature attributes, this widget is the first in a suite of widgets that will constitute the full 4.x editing experience. Each editable attribute has an auto generated UI based on the data type for a smooth editing experience.
To see this widget in action, see the FeatureForm sample.
Sketching update: add and remove vertices. As of September 2017 (version 4.5) you can enable basic sketching in your apps using the API’s sketch tools (SketchViewModel). Version 4.9 introduces the ability to edit polyline and polygon geometries by adding new vertices or deleting existing vertices. As an enhancement exclusive to the 4.x API, it is possible to undo/redo at the vertex level in addition to completed geometries.
* Note that adding and removing vertices will be available on touch devices starting with version 4.10.

Navigate with a Gamepad
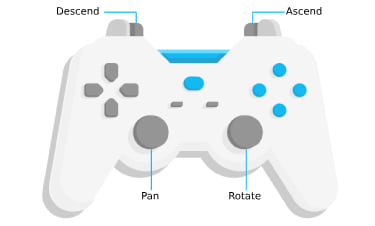
Do you want to effortlessly pivot around an underground deposit, fly around a city like superman or tour an art gallery? This can be somewhat cumbersome and difficult to achieve with a mouse and keyboard. The API now includes support for navigation in 2D and 3D using any Standard Gamepad or 3Dconnexion device. Simply connect your gamepad via USB or Bluetooth and start exploring. To learn more, check out the recent blog: Improved map and scene navigation with gamepad support.
Broader WebGL support for 2D mapping
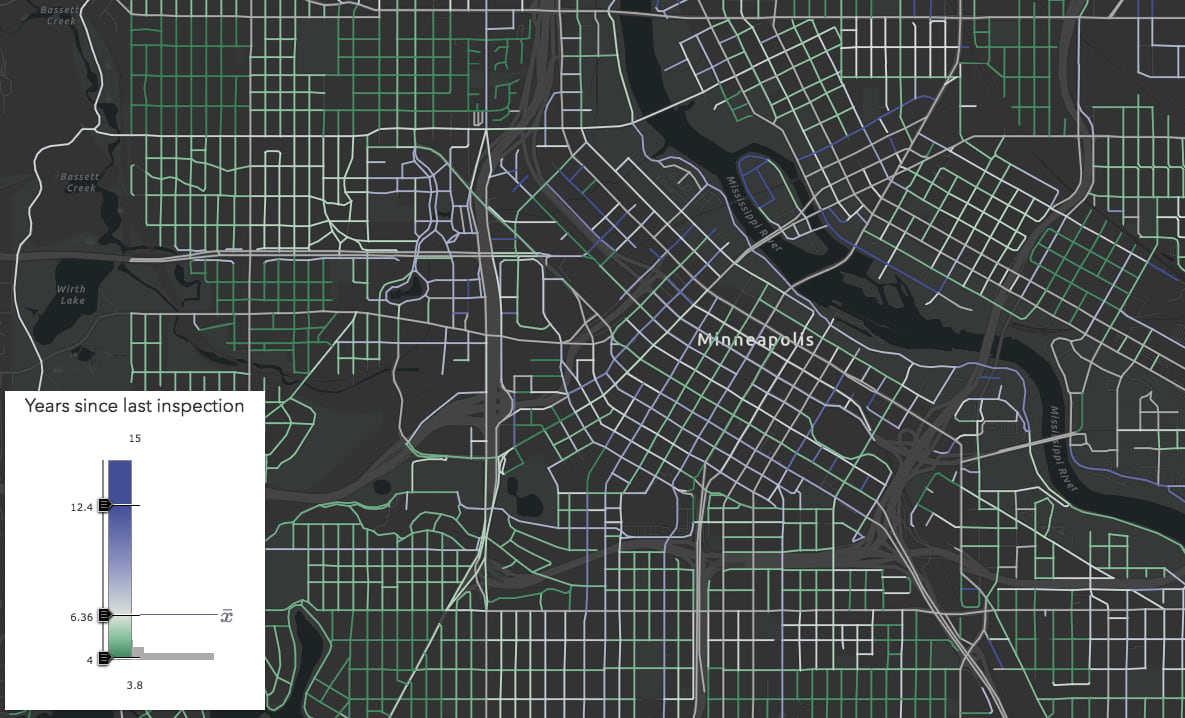
Rendering graphics in WebGL has resulted in the far more rapid display of both small and large datasets. The number of features that can be displayed—while still maintaining a high level of performance—went from tens of thousands of features to hundreds of thousands of features. Due to the clear superiority of rendering with WebGL versus SVG (the legacy rendering mechanism) and broad browser support, WebGL rendering has become the primary way in which the API renders graphics. This expanded usage will be evident in 4.9 and even more so in 4.10.
Until 4.9, WebGL rendering of 2D map views was released in beta and developers had to explicitly set a flag in order to use WebGL. Starting now, WebGL rendering is out of beta and is the default rendering engine. CSV layers, feature collections, stream layers, and all feature services regardless of whether they were published with ArcGIS Online or ArcGIS Enterprise (all versions) are rendered with WebGL. All layer types that are rendered with WebGL in 2D map views also have support for client-side queries, including the recently enhanced stream layer.
For now, if you have a requirement to use SVG instead of WebGL for rendering, you will be able to configure your app to use SVG. However, starting with 4.10 (December 2018), WebGL is the only planned rendering mechanism.
Feature Layer updates
In this release, we added support for querying related features as well as adding, deleting and updating feature attachments in feature layers. In addition, similar to the CSV layer, when you create a feature layer with a client-side data source (i.e. using a feature collection) you can perform the full spectrum of spatial, attribute, and statistical queries. This means that the developer can now execute a query without being concerned about the layer type or source (client-side or server-side).
More updates to feature layers can be found in the release notes.
Take a screenshot of a 3D scene
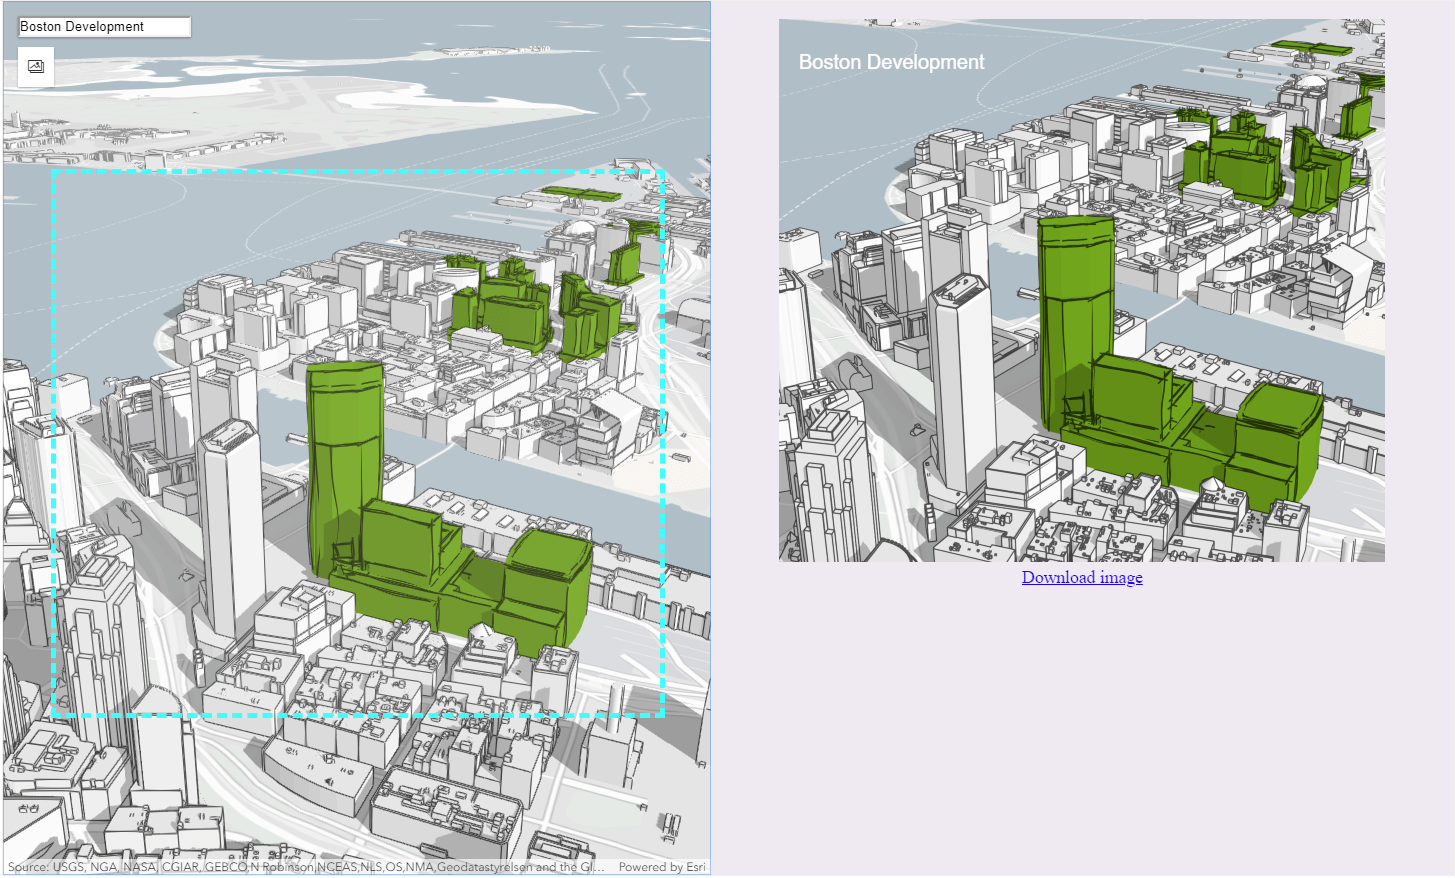
Using SceneView.takeScreenshot() you can now create a screenshot of the view and export it as an image. Different options like image format, quality, aspect ratio or image size can be specified. See the Take a screenshot of a SceneView sample to learn more about this feature.
Smart mapping updates
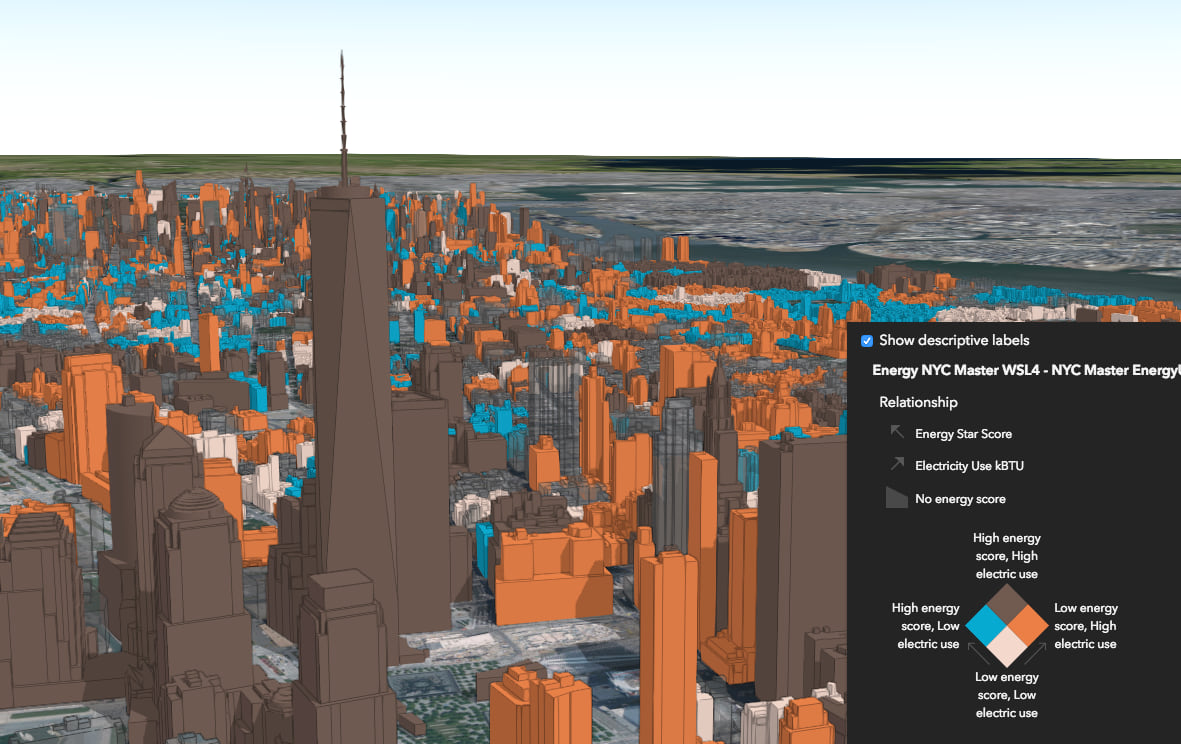
We added Predominance, Relationship, Age with color, and Age with size renderer creator methods:
-

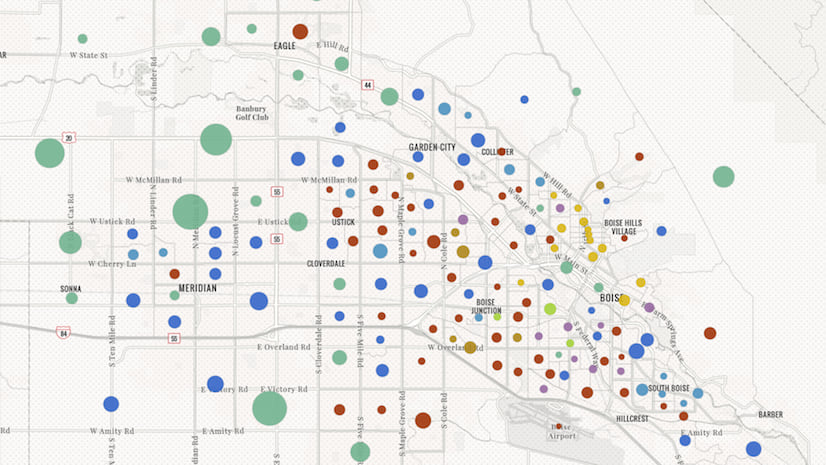
Predominance visualizations color features based on which field from a set of competing fields beats the others in value. This app shows the most common decade homes were built in each Census Block Group of Boise, Idaho.
An optimized approach to working with CORS
CORS support has been enhanced in version 4.9. The primary reason behind this is the move to WebGL becoming the primary way the API handles working with graphics.
Beginning in version 4.9, the API assumes CORS support in web servers. If this is not the case, you can still configure your application to reference a proxy file as an alternative to working with a server configured for CORS. For additional information on what specifically changed between versions, please refer to the CORS and the ArcGIS API for JavaScript: Changes coming in 4.9 blog article written specifically to address this update.
Learn more
For a full list of enhancements, breaking changes, and bug fixes be sure to check out the release notes:
- Version 4.9 release notes and samples
- Version 3.26 release notes (primarily bug fixes)


Commenting is not enabled for this article.