Goodbye 2020, hello version 4.18 of ArcGIS API for JavaScript! The development team has been hard at work building many enhancements that are frankly game changers in both 2D and 3D apps. In addition, we have removed IE11 and Edge Legacy support with this release.
Let’s have a look at some of the new capabilities that you can now start building into your apps…

If you use the ArcGIS API for JavaScript with a third-party framework such as Angular or React or create custom builds of the API, this process just got easier. ES modules is a new option for consuming the API, which enables simplified code and seamless integration with modern frameworks and build tools.
To get started, you’ll install a new NPM package @arcgis/core and then you can use native imports like this:
import WebMap from ‘@arcgis/core/WebMap’;
import MapView from ‘@arcgis/core/views/MapView’;
Review the ES modules guide topic for the complete steps necessary for using ES modules. There are also sample apps available that demonstrate the core concepts for integrating the modules with various frameworks and tools.
Should You Migrate to ES Modules?
If you aren’t integrating with a framework or creating custom builds of the API, there is no need to migrate to the new ES Modules. The AMD modules (which is the alternative – and original – way that the API can be consumed) will continue to be available alongside the ES modules for the foreseeable future. Both formats have the same capabilities because they are built from the same code base.
Visit Introduction to tooling to learn how to use the new modules and learn whether you should migrate.
Query clustered features
You can query features from clusters to get access to the underlying features represented by a cluster. This allows you to do the following:
- Query statistics for the clustered features.
- Display the visible extent of a cluster’s features.
- Calculate and display the convex hull for clustered features.
- Display the features belonging to a cluster.
Layer effects
You can now apply Effects to all layers in 2D MapViews, either to features that meet filter criteria or across an entire layer. This powerful capability allows you to apply css filter-like functions to layers to enhance the cartographic quality of your maps.
Applying an effect selectively based on filter criteria via FeatureEffect was released in version 4.11. This release introduces the ability to apply an effect across an entire layer, and introduces the new effect types – bloom, drop-shadow and blur. Let’s explore each of these!
Blur
The blur effect applies a Gaussian blur to the layer and it makes it look out of focus or blurry. One use for it is to soften a layer underneath a reference layer, or other layers of importance, so the features above it can stand out more clearly. You can also use it to visualize uncertainty to non-discrete boundaries like habitat boundaries.
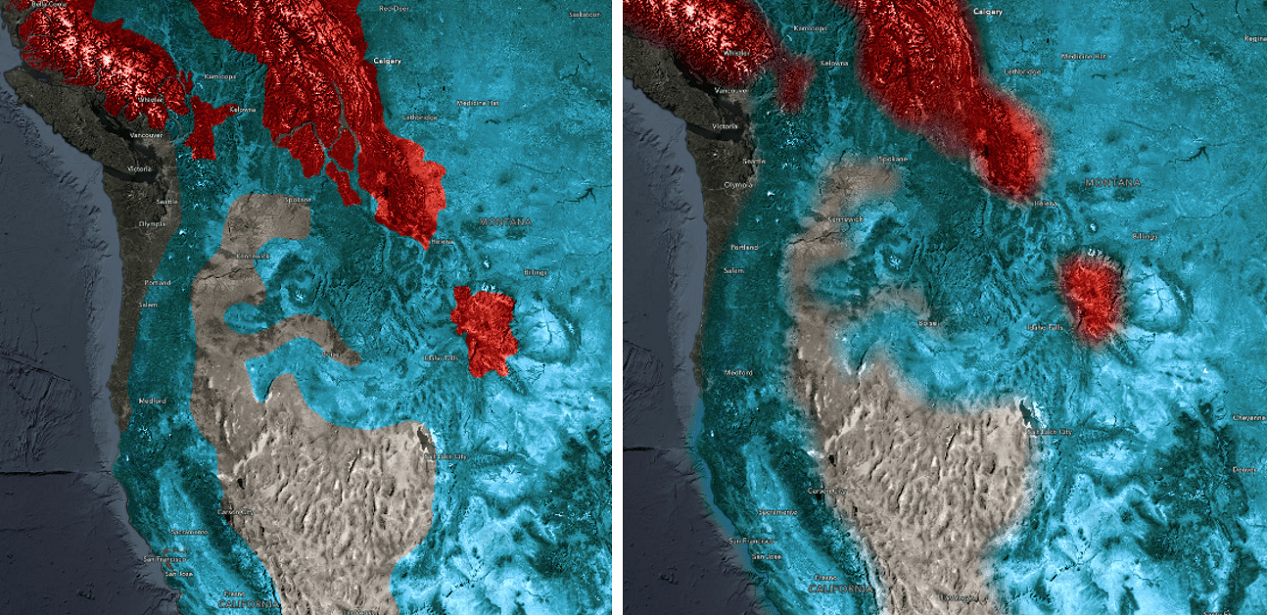
Bloom
This effect produces fringes of light extending from the borders of bright areas in a layer. You can add glow to your layers when mapping fires, volcanic eruptions, night lights, or to put an electric highlight on features you want to draw attention to (like in the updated sample that shows New York building footprints by construction year). You can combine multiple effects in a layer, and use effects on any number of layers in a map. In the below map, active fire locations have a bloom effect while the smoke layer has several effects including blur for a fuzzy boundary.
Drop shadow
This effect is useful when you want some features to stand out from the rest of the features on a busy map. For example, you can apply this effect to your labels (reference layer) to make them legible.
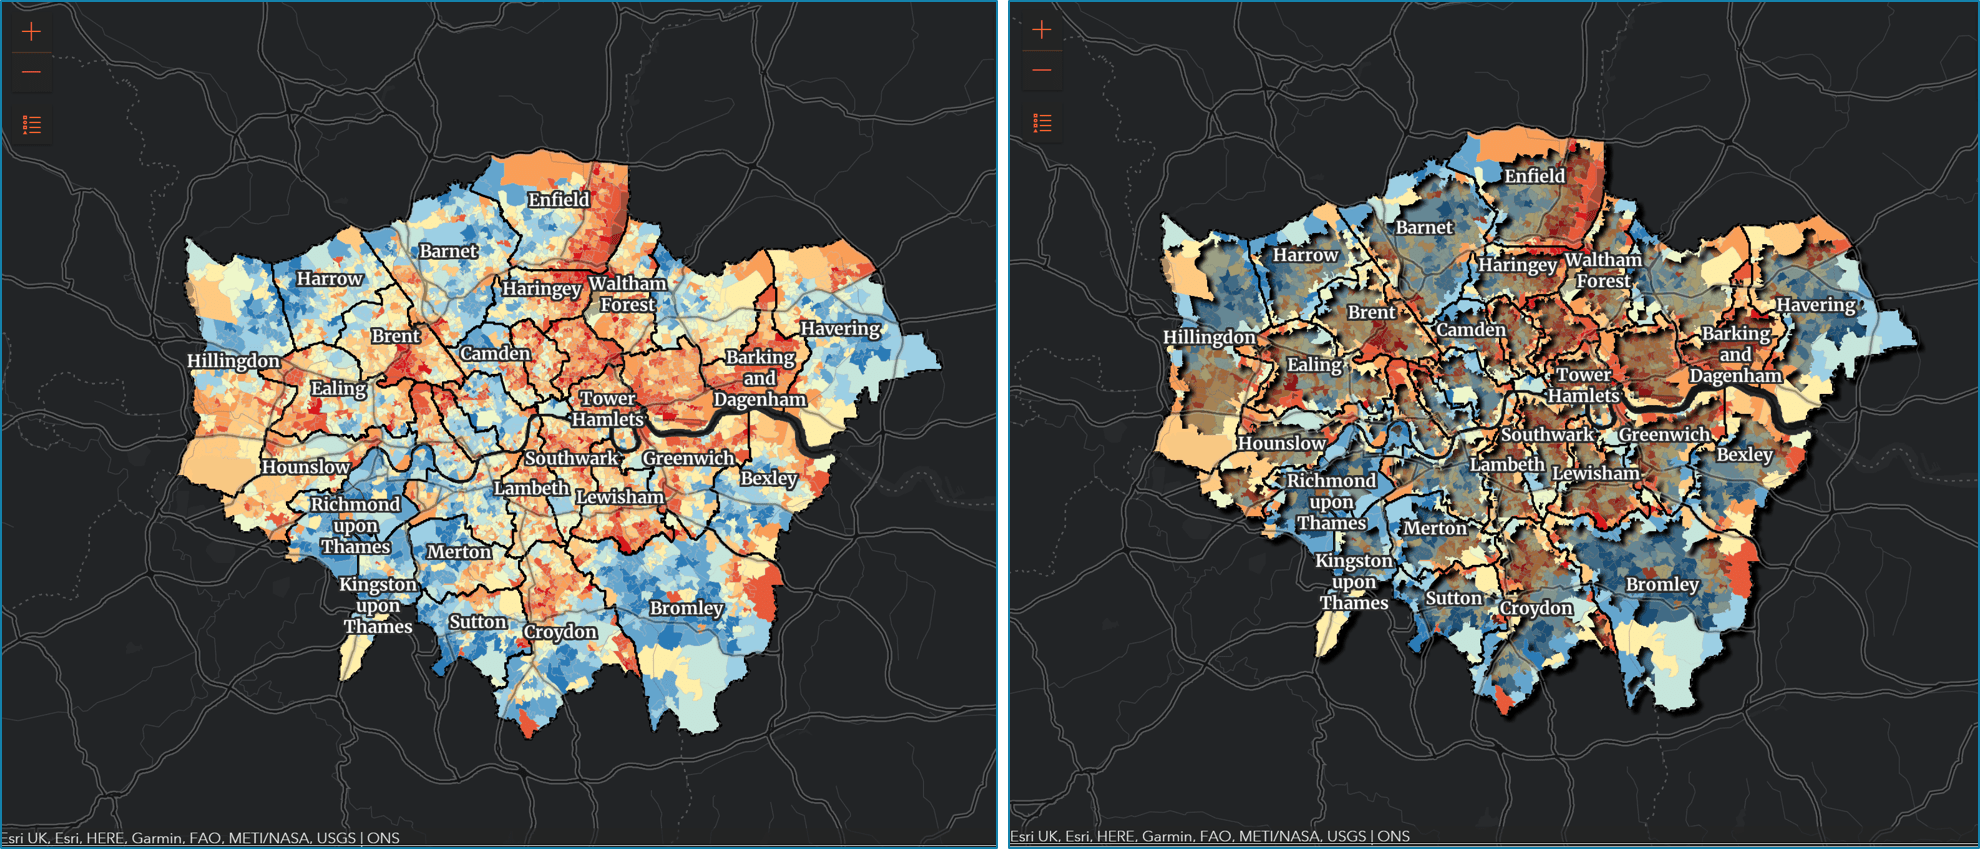
The following screenshots show the same map, with and without effects. On the right, drop-shadow is applied to features that intersect boundaries of London boroughs while blur and (reduced)brightness effects are used to deemphasize features do not meet this criteria. The map (inspired by this tweet) shows the overall index of multiple deprivation in 2019 experienced by people living in the Greater London area.
Since some effects like drop-shadow and blur are sensitive to scale, we also enhanced the Effect API to make effects scale-dependent.
Learn more by exploring the samples that take advantage of these effects which can really transform your map and the overall experience of your app. You can also dig a little deeper by reading about each of the effects.
Elevation profile widget (beta)
Create elevation profile charts using the new ElevationProfile widget, available in both MapView and SceneView. Interactively draw or select existing lines in your map or scene to compare heights for terrain but also 3D objects such as buildings. The chart is computed using the ground’s elevation and provides additional statistics along the line. Customize the widget by toggling its visible elements and adjusting labels and line colors.

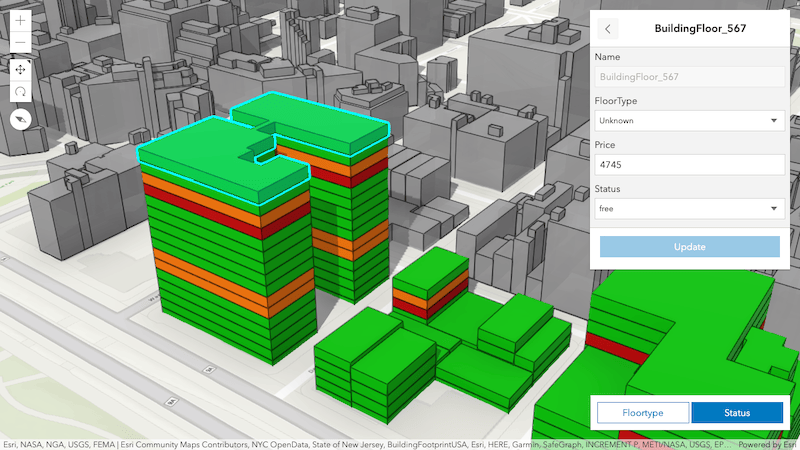
3D web editing
Earlier this year we introduced 3D feature layer editing. This effort continues in the latest release by adding support for new layer types and interactive helpers.
Edit attributes in scene layers
You can now update the attributes of 3D object SceneLayers using existing Editor widget workflows or programmatically calling applyEdits(). Edits are applied to the associated feature layer but taken into account and rendered by the API until the I3S cache is updated. This approach is consistent with how other products such as ArcGIS Pro treat scene layer edits.
Self-snapping
When interactively modifying line and polygon geometries the new self snapping capability helps you draw precise geometries with geometric constraints such as parallel lines and right angles when editing feature layers in 3D scenes. Enable self snapping through the new SketchViewModel.snappingOptions property and toggle it during a draw operation.
This is the first step towards enabling full feature snapping in both 2D and 3D editing workflows. This support will be expanded incrementally over subsequent releases.
Context-aware navigation
Interactive zooming, panning and rotating in underground scenes or viewpoints with large tilt has greatly improved. Navigation used to jump when the input device pointed at the horizon or simply the background for scenes with no visible ground. A new context-aware navigation takes visible objects into account to better predict the area of interest. You will notice a steadier navigation experience, especially when moving around and towards subsurface pipelines and earthquakes for example.
Order-independent transparency
The previous approach assured that the front-most transparent surface and any opaque features behind are always rendered. Depending on the camera position, other transparent features in the back were selectively visible, causing them to flicker when navigating.
A new order-independent transparency (OIT) makes sure all transparent objects are rendered independently of the camera. This is useful when visualizing large volumetric symbology covering other transparent features. Scenes with semi-transparent 3D WebStyles or transparent icon symbology like the Firefly style also benefit from this improved transparency.
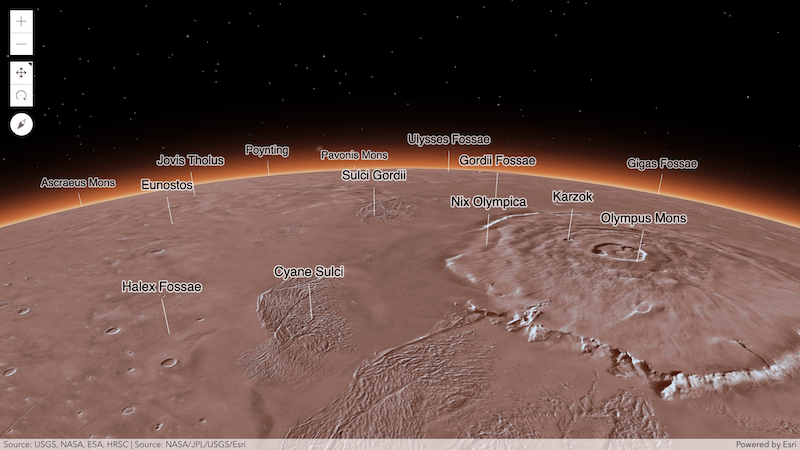
Mars and Moon support
It is safe to say that the API covers new grounds in this latest release. Use SceneView to explore imagery and elevation layers of the Moon and Mars but also feature layers containing mapped information about these astronomical bodies. Atmosphere and physical dimensions used in interactive tools such as measurements are automatically adjusted when loading a layer with a supported extraterrestrial coordinate system.
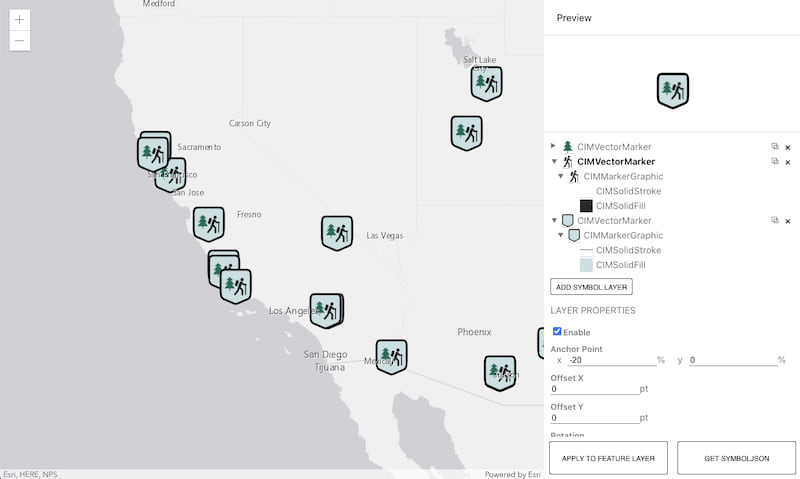
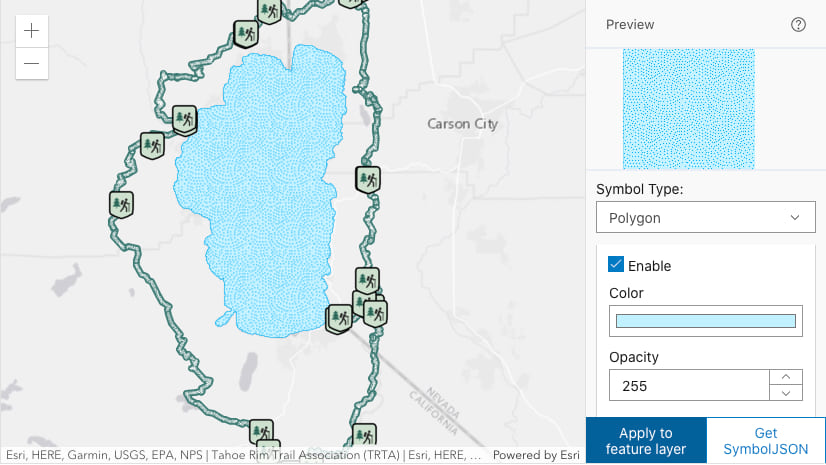
Vector Symbol Builder
You can symbolize your graphics and features using CIMSymbols which are multi-layer vector symbols that display crisp at any scale. These symbols are powerful because you can design your own custom CIMSymbol using one or more symbol layers, and even update individual symbol layers dynamically based on application logic and attribute data. To aid in the process of creating custom symbols, we introduced a CIM Symbol Builder. This app provides an environment where you can design CIM symbols with a simple user interface, copy the JSON of the symbol, and use it in a web application built with the API. Learn more about this tool in the recent CIM Symbol Builder blog.
Sketch widget: selection
The Sketch widget got a lot of love this release. In addition to some performance and visual quality improvements, we added two new selection tools: rectangle-selection and lasso-selection. The end user can use these tools to select one or more graphics and rotate, scale, move, or delete all selected graphics at once. In an upcoming release, we will enable the same capability in the editor widget.

End of IE11/Edge Legacy support
Support for Internet Explorer 11 and Edge Legacy for use with the ArcGIS API for JavaScript was deprecated as of version 4.16. Version 4.17 was the last release with support for these browsers. This means that apps built with 4.18 (and beyond) will not function in IE11/Edge Legacy. See our updated System Requirements page and the Why is Esri ending support for Internet Explorer 11? blog to learn more.
Get the full scoop…
There are many more updates in this release such as the ability to use custom print layouts, ImageryLayer enhancements such as identify, and custom websocket support for stream layers in 3D scenes. Make sure you check out the release notes and play with the samples to get a feel for this release!
We wish happiness and health to our developer community in the new year!

Lego photo by Elodie Oudot and sparkler photo by Jamie Street on Unsplash


Article Discussion: