The October update to the ArcGIS API for JavaScript is here, and it packs a punch with a range of new features and enhancements. A major theme for version 4.17 is performance – in particular, if you are working with large datasets, we highly encourage you to test your apps with this release. Performance improvements reached across feature layers, all client-side layers, and point scene layers. Let’s explore some of the highlights of this release.
Feature layer performance enhancements
Every release, we look for ways in which we can further optimize performance. This release brings critical performance enhancements for feature layers. As with almost all performance enhancements, the impact and visual improvement in apps varies depending on characteristics of the app, the data it is loading, and properties of the services themselves. Apps that will see the most drastic performance gains with this release are:
- Applications using a large number of attributes
- Applications with a large number of features (requiring multiple server queries per feature tile)
- Features that make use of fill symbology
Expand here to learn more about what is going on under the hood…
Faster load time of data-heavy apps
We’ve overhauled the feature processing pipeline, which significantly improves the load time of data-heavy apps. While the performance improvements will vary significantly between maps, we’ve found that maps that make use of many attributes benefit the most.
Progressive loading of feature tiles
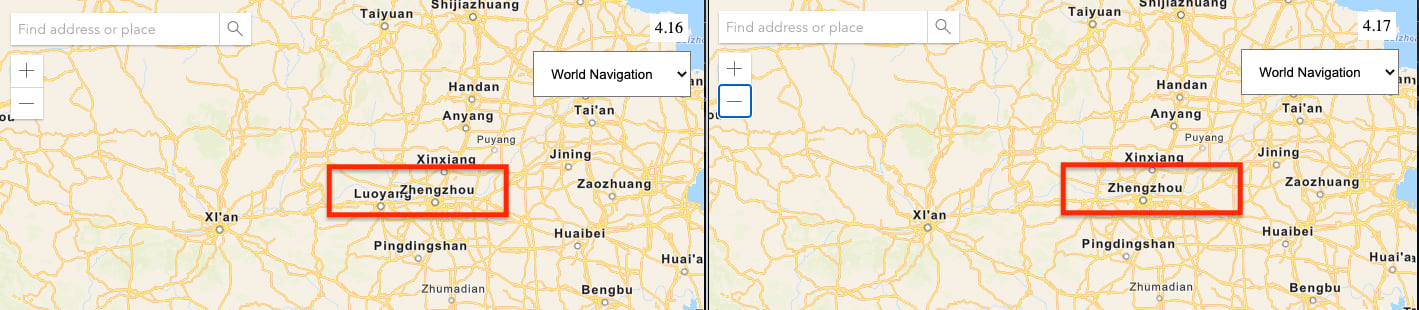
We also improved the experience when loading feature-dense datasets. As you might already know, features are requested in feature tiles which are built for high-performance caching. The API draws features incrementally as they are loaded, which results in a visual progression of the loading tile. This can be observed in the animation above which compares loading a feature layer with more than 1.1 million building footprints in version 4.16 (left) and 4.17 (right).
Better data processing and memory management
The API requests data in protocol binary format (PBF) by default. All PBF parsing now happens lazily, and we keep PBF-encoded features in their native binary format, using binary readers to work directly on the compressed feature data. This allows the data processing to scale better, and help to alleviate memory pressure, as we no longer need to deserialize individual features.
More stable and flexible stream layers
With the growing demand for apps that can visualize and analyze real-time data feeds with a skyrocketing number of observations per second, we have revamped the StreamLayer in two ways:
- More observations: Enabled it to handle faster streams with more data
- Custom WebSockets: Expanded it to work with custom WebSockets
More observations
With some streams pushing tens to hundreds of thousands of observations per second through a WebSocket, the StreamLayer needs to be able to adapt to the incoming observations based on the client’s capabilities. Additionally, web apps are typically expected to work across desktops and mobile devices alike – which vary in processing power and available memory.
With the latest updates, the StreamLayer will display the observations when possible, and apply logic for handling when the client’s capabilities (like available memory and processing power) can’t handle the speed of updates. With this improvement, the app doesn’t run out of memory and cause the system to get bogged down. Once ready, the updates can be patched in and seen on the map.
Consume streams from any source
Prior to 4.17, StreamLayers worked with Esri Stream services coming from either ArcGIS GeoEvent Server or ArcGIS Velocity (previously called ArcGIS Analytics for IoT). With this update, you can consume streams coming from your own custom WebSocket – essentially data coming from anywhere. The basic requirements for the stream are outlined in the documentation such as a single geometry type, the inclusion of a unique ID field, and a track ID field. Check out Reference a custom stream service for more information.
Faster client-side layers
CSVLayer, FeatureLayer, and GeoJSONLayer created from client-side graphics are now taking advantage of a worker to store the data. This means you can perform more queries on your client-side layers in a background thread without interfering with the user interface.
For larger datasets, you might also notice that these layers display the same (improved) progressive loading experience described above for FeatureLayers. Rather than waiting for an entire tile to be loaded and parsed, features are displayed as soon as they are ready for display.
Vector tile layers: Better navigation and display
Vector tile layers have an improved experience when loading and interacting with the map. As you zoom in and out and navigate the map, symbols fade in and out, providing a smooth transition between visibility changes. Optimizations to algorithms for label deconfliction along tile boundaries and during map rotation resolved issues in previous releases with overlapping or cut-off labels that crossed tile boundaries.
The below image illustrates the results of the updated label deconfliction algorithm, with version 4.16 (left) and 4.17 (right).
3D updates
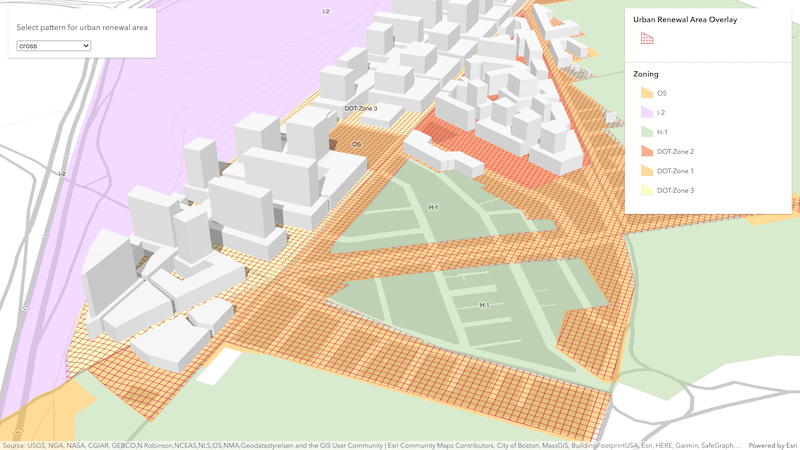
New polygon fill patterns
The new polygon fill patterns allow you to highlight areas on terrain or integrated mesh layers. You can apply the same pattern for all polygons in the scene or classify them based on attributes. In the below sample, polygon fill patterns are used to visualize urban development areas.
SceneLayer performance
Point SceneLayers now load and display up to twice as fast by supporting the latest I3S specification version 1.7, allowing you to render scenes with vast amount of point symbols more efficiently. Similar to IntegratedMeshLayer and 3D object SceneLayers, you can update your existing SLPKs using the I3S converter tool to benefit from these performance improvements. For more details, read the Working with scene layers guide topic.
Mapping bells and whistles
Constrain the visible map extent
In addition to the already supported rotation, scale, and zoom constraints on the view, you can now constrain navigation to a polygon or extent. This is handy for focusing viewers on the relevant locations and minimizing distractions from other areas of the map. So, for example, you could constrain the view to the boundary of a school, a city, or even a country.
const view = new MapView({
    container: "viewDiv",
    map,
    extent: park.extent,
    constraints: {
      geometry: park
    }
});
Layer visibility animations
We added a fade-in and -out animation to the LayerView when the layer’s visibility transitions between on and off in a 2D map.
Time support for WMSLayers
WMSLayer now supports layers that are time enabled. You can use the TimeSlider widget to animate your layers over a period of time, or you can set a timeExtent on the layer to only request data that falls within the given time extent. The timeInfo property is set at WMSLayer initialization if the layer has one or more time dimensions.
Raster updates: Vector symbology and WCS layers
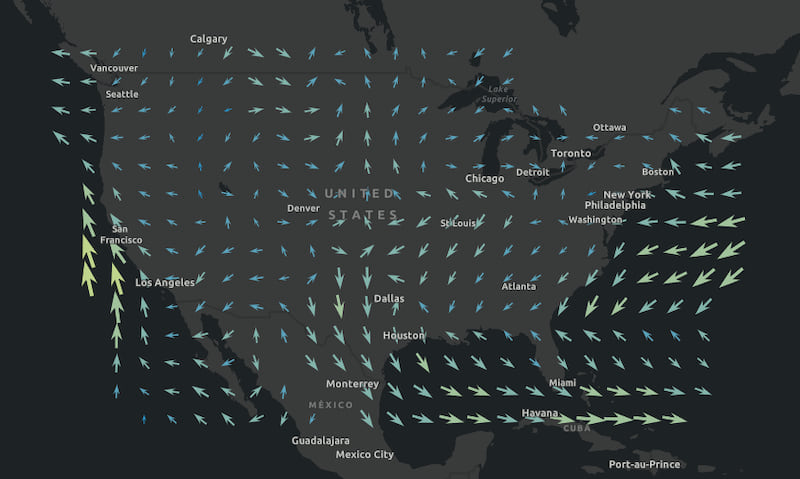
Display raster data using vector symbols
Using the new VectorFieldRenderer class, you can symbolize raster data using vector symbols. This is often used for visualizing flow direction and magnitude in meteorology and oceanography raster data. The direction of the raster defines the angles, while the magnitude of the raster defines the size of the symbol.
New WCS Layer
The WCSLayer (beta) enables you to display raster data from an OGC Web Coverage Service.
Widget updates
There are a variety of updates to widgets in this release. At a very high-level:
- Print: This widget now exposes new properties and events for developers wanting to customize the print experience. For example, the complete and submit events can be used by developers to manage printing results and behavior.
- Bookmarks: This widget is enhanced with the ability to add or edit a thumbnail. In addition, previously, only the extent of the bookmark was stored. Now users can create bookmarks that also captures the current scale and rotation.
- FeatureTable: This widget has improved accessibility and new support for editing date fields.
- FeatureForm: This widget has the ability to limit min/max ranges for date input as well as whether or not to include an input for time. This is achieved by configuring the new DateTimePickerInput UI.
- TableList: The new TableList widget provides a way to display a list of tables within a map.
ES Modules – in development
We have made progress towards delivering the API as ES modules, which will enable you to easily integrate the API with modern frameworks and developer tooling. This project is currently in development and is not intended for use in production applications. We plan to release the modules in beta at 4.18 with a production release planned for early 2021.
Consuming the API with @arcgis/core ES modules will be an additional option alongside the existing AMD modules. If you’d like, try out the modules while they are in development, and provide feedback via the early access /next repo.
Last release with IE11/Edge Legacy support
Support for Internet Explorer 11 and Edge Legacy for use with ArcGIS API for JavaScript was deprecated as of version 4.16. Version 4.17 is the last release with support for Internet Explorer 11 and Edge Legacy browsers. That means that apps built with 4.18 and beyond will not function in IE11/Edge Legacy. Users are strongly encouraged to move to a modern browser such as Mozilla Firefox, Google Chrome, the new Microsoft Edge, or Safari.
See this recent blog that covers ArcGIS Online, ArcGIS Enterprise, and the ArcGIS API for JavaScript, and our updated System Requirements to learn more.
There’s more…
This blog is just an overview of some of the release highlights. You can learn more about the latest innovations in the release notes and play around with the collection of 4.17 samples to get a feel for the new capabilities.


Looks good
Hi there
thanks for all the info!
we’ve downloaded the api to our local env
it look like there is a very BIG problem with WMTS layers
it crash when trying to fetch tileslots of white spaces, zoom in\out not working well
we use the api since version 12 and it all worked perfectly
do you know if its some kind of know issue?
we’ve waited to the FeatureLayer improvement but now the map is pretty much useless
Thanks
Hello! Could you please contact support regarding this issue? They can help troubleshoot/reproduce it and work with development to get it fixed. Thank you!