Edited March 23, 2022 to include updates in the 4.23 release of the ArcGIS API for JavaScript.
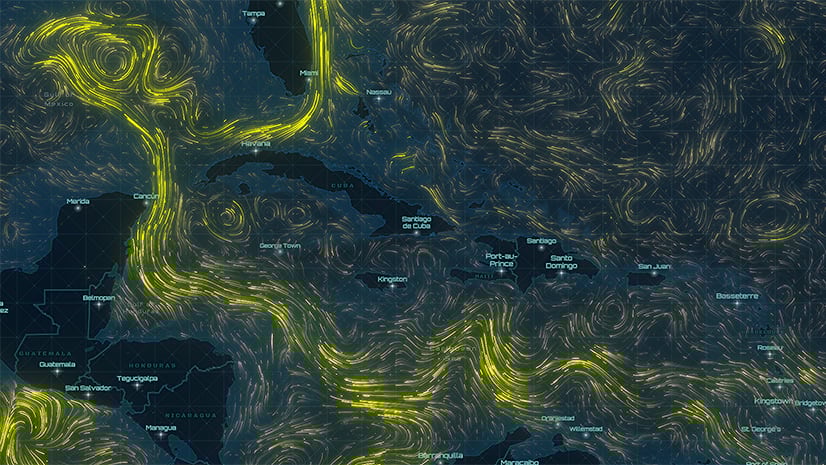
Version 4.23 of the ArcGIS API for JavaScript brings the official release of a new renderer, the FlowRenderer, that allows you to visualize your UV or MagDir raster data with animated streamlines. This renderer allows you to create visually stunning maps with only a few lines of code.
The FlowRenderer can be used to visualize flow direction and magnitude for meteorology and oceanography raster data. The direction of the raster defines the direction of movement, and the magnitude defines the visible length of the streamline.
If you already have an ImageryLayer or ImageryTileLayer with UV or MagDir data published, you can start using this renderer instantly, and can skip ahead to the section on using the FlowRenderer in your maps.
First, I’ll first walk you through how to publish your raster data to ArcGIS Online, then show you how to render it in your maps with the AnimatedFlowRenderer.
You can also publish your raster data using ArcGIS Enterprise. Check out their documentation on Publishing image services for more information.
Publishing your raster data in ArcGIS Online
To publish your raster data as a hosted layer, log in to ArcGIS Online and click on the Content tab. At the top of that page, select the New item button in the top left.

Clicking that button will open a modal that allows you to select what type of item you want to add. In this case, you’ll select Imagery layer.

The next dialogue will ask you what type of layer you want to create. In this case, select Tiled Imagery Layer since it can easily be hosted in ArcGIS Online, and works with our FlowRenderer. The FlowRenderer is supported on both ImageryLayer and ImageryTileLayer, but an ImageryLayer created in ArcGIS Online cannot be shared publicly. You can also host either an ImageryLayer or ImageryTileLayer in ArcGIS Enterprise.

Next, you need to decide how you want to configure your layer. The documentation on publishing hosted imagery layers contains more detailed information on each configuration option. I am going to configure my layer as One Mosaicked Image.

Now I can just drag and drop my CRF with MagDir information to create the layer. This is created from a netCDF file, which has been processed and prepared for publishing. To learn more about how to prepare your data for publishing, check out this blog, Visualize Raster Using a Vector Field in ArcGIS. For the raster type to describe my dataset, I’ll just keep Raster dataset selected, and I don’t need to configure any additional properties.

And finally, I’ll define a title for my layer, and click “Create”. After a short amount of processing time, that layer will be hosted and ready to use in your apps!
Using the FlowRenderer in your maps
Once you have published your data to a service, you’ll need to use an ImageryLayer or ImageryTileLayer (depending on how you published it) to create a layer from the service for use in your map. I’m going to use an ImageryTileLayer, since I published an ImageryTileLayer in the previous section.
require(["esri/layers/ImageryTileLayer"], function(ImageryTileLayer) {
   let layer = new ImageryTileLayer({
      url: "url to your service"
   });
});
When you initialize the layer, you can also define how the layer is rendered – that’s where the FlowRenderer comes in to play. To apply the FlowRenderer to your layer, simply import the FlowRenderer and set the renderer property on the layer to new FlowRenderer(). This will create a new FlowRenderer with all the default property values applied.
require(["esri/layers/ImageryTileLayer", "esri/renderers/FlowRenderer"],
  function(ImageryTileLayer, FlowRenderer) {
     let layer = new ImageryTileLayer({
        url: "url to your service",
        renderer: new FlowRenderer()
     });
  });
You can now add this layer to your map using map.add(layer) and voila! You’ve just created a stunning flow visualization with just a few lines of code.

Updating the properties of the FlowRenderer
You might want to adjust the default settings for the flow renderer – that’s why we provide 8 different properties that you can use to customize your visualization: color, density, flowRepresentation, flowSpeed, maxPathLength, trailLength, trailWidth, and visualVariables.
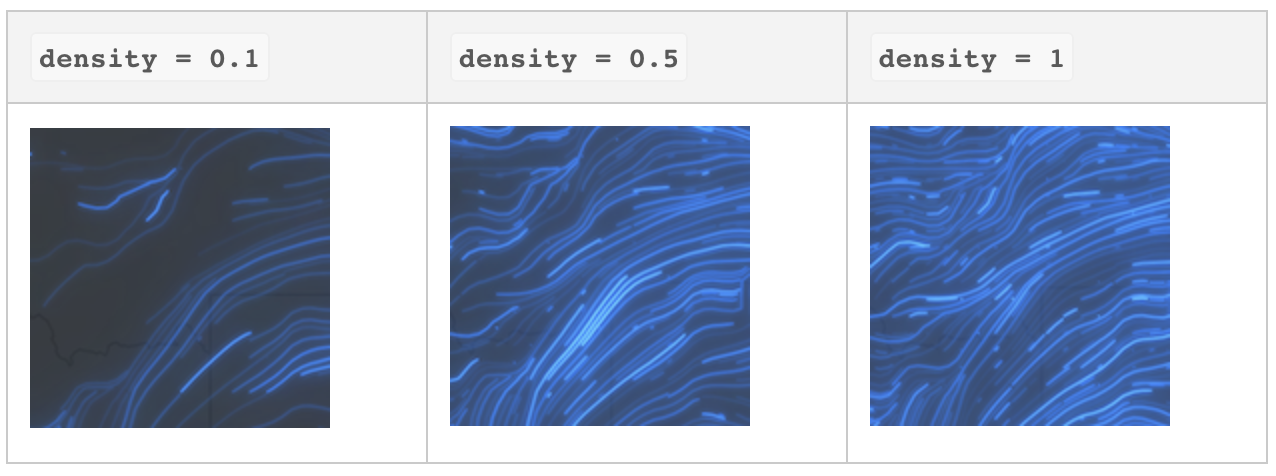
color: The color of the streamlines. Default is[255, 255, 255, 1](white).density: The density of the streamlines. Accepted values are between0and1, with1being the most dense, and0meaning no lines will render. Default is0.8.
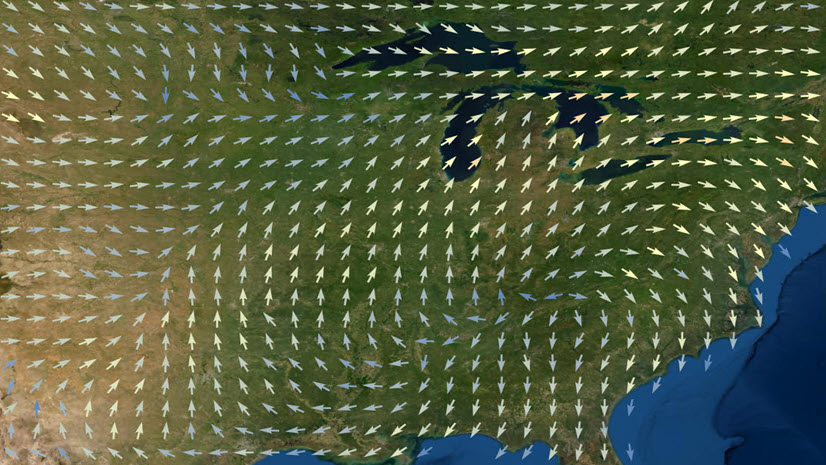
flowRepresentation: Defines the flow direction of the data. This can be modified to display meteorological (the direction it is flowing from) or climatological data (the direction it is flowing to). Supported values are"flow-from"or"flow-to".flowSpeed: The speed of the animated streamlines, relative to the simulation time. Default is10.maxPathLength: The maximum length the animated streamlines will travel. Only a portion of the streamline will be visible at a time depending on the magnitude or UV coming from the raster layer and the defined trailLength. During the course of the animation, the visible streamline will travel to reach the line length defined here, then will restart. Default is200pts.trailLength: The approximate visible length of the streamline in points. The streamlines will appear shorter when the trailLength is a smaller number, since they will start to fade before they reach the full maxPathLength. Default is100.
trailWidth: The width of the streamline trail in points. Default is1.5.visualVariables: The FlowRenderer supports the following visual variables: ColorVisualVariable, OpacityVisualVariable, and SizeVisualVariable. Each of these visual variables can only be used with theMagnitudefield.
Using all of these different properties, you can customize the FlowRenderer to create some unique visualizations. Check out this sample where you can change the property values on the fly.
You can also take advantage of other features in the API with this new renderer – like layer effects and blending! Layer blending is a great way to create a multivariate visualization with the FlowRenderer, as shown in this new sample that blends ocean currents and sea surface temperature.
No code version? We got you.
If you’re interested in doing this kind of visualization, but don’t want to write the code for it yourself, you can use the new Flow style in the Map Viewer. Check out this blog post to learn more.

Article Discussion: