Some scientific phenomena in the ocean or atmosphere, such as wind and current, are normally measured with a pair of variables. The pair can be either magnitude (speed) and direction, where magnitude measures how fast wind or water flows, and direction measures the direction of the flow. These can also be measured as U and V components, where U is the velocity toward east, and V is the velocity toward north. This blog describes the capabilities of visualizing wind and ocean current data in ArcGIS, as well as the workflow for preparing layers for visualization.
Visualization capabilities
To visualize wind or water flow, it is common to use vectors to symbolize size, color to represent speed, and symbol angle to represent flow direction. So how can you visualize the two rasters, either magnitude and direction variables, or U and V components? ArcGIS has a vector field data type and special renders for this purpose.
There are two rendering mechanisms in ArcGIS. One is vector symbol drawing, in which the raster is divided into tiles, magnitude and direction values are calculated for each tile, and a vector symbol is drawn for each tile using the calculated magnitude and direction. Data containing U and V components will be automatically converted to magnitude and direction during drawing. This display mechanism is used in ArcGIS Pro, and Map Viewer in both ArcGIS Online and ArcGIS Enterprise. The other display mechanism is the animated flow renderer, which uses animated streamlines to visualize the magnitude and direction of the flow. This renderer is currently available in ArcGIS API for JavaScript and will be coming to the Map Viewer soon. Below are examples of visualizing this type of data using various ArcGIS products.
Visualize wind data in ArcGIS Pro
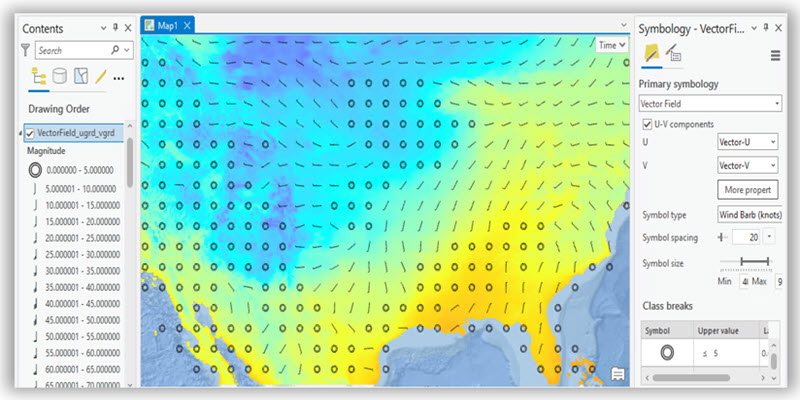
The map displays wind data on top of a temperature layer for the continental United States. The layer is composed of U and V components of wind, and displayed using the wind barb symbol of the Vector Field renderer. More vector symbol types are supported; see this help topic for more information on how to work with the Vector Field renderer in ArcGIS Pro.
Visualize an imagery layer of ocean current data using Map Viewer
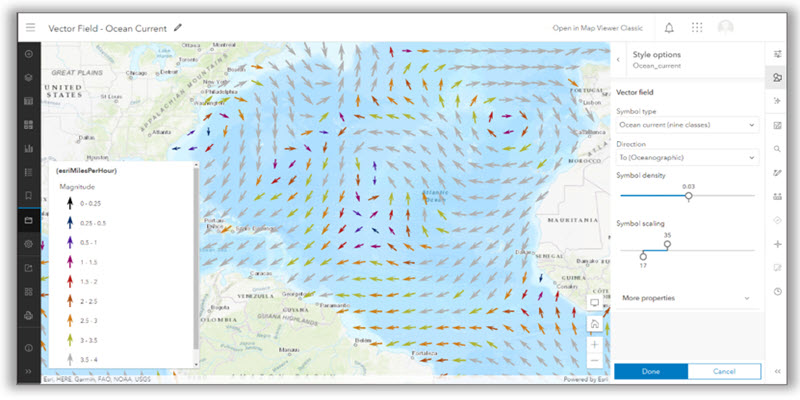
This imagery layer in ArcGIS Image for ArcGIS Online contains magnitude and direction variables of ocean currents. The map displays using the Vector Symbol renderer in Map Viewer, in which arrows point to the flow direction and color indicates the speed. Since the imagery layer is multidimensional, the time slider can be used to animate wind flow through time.
Visualize an imagery layer of wind using Animated Flow Renderer
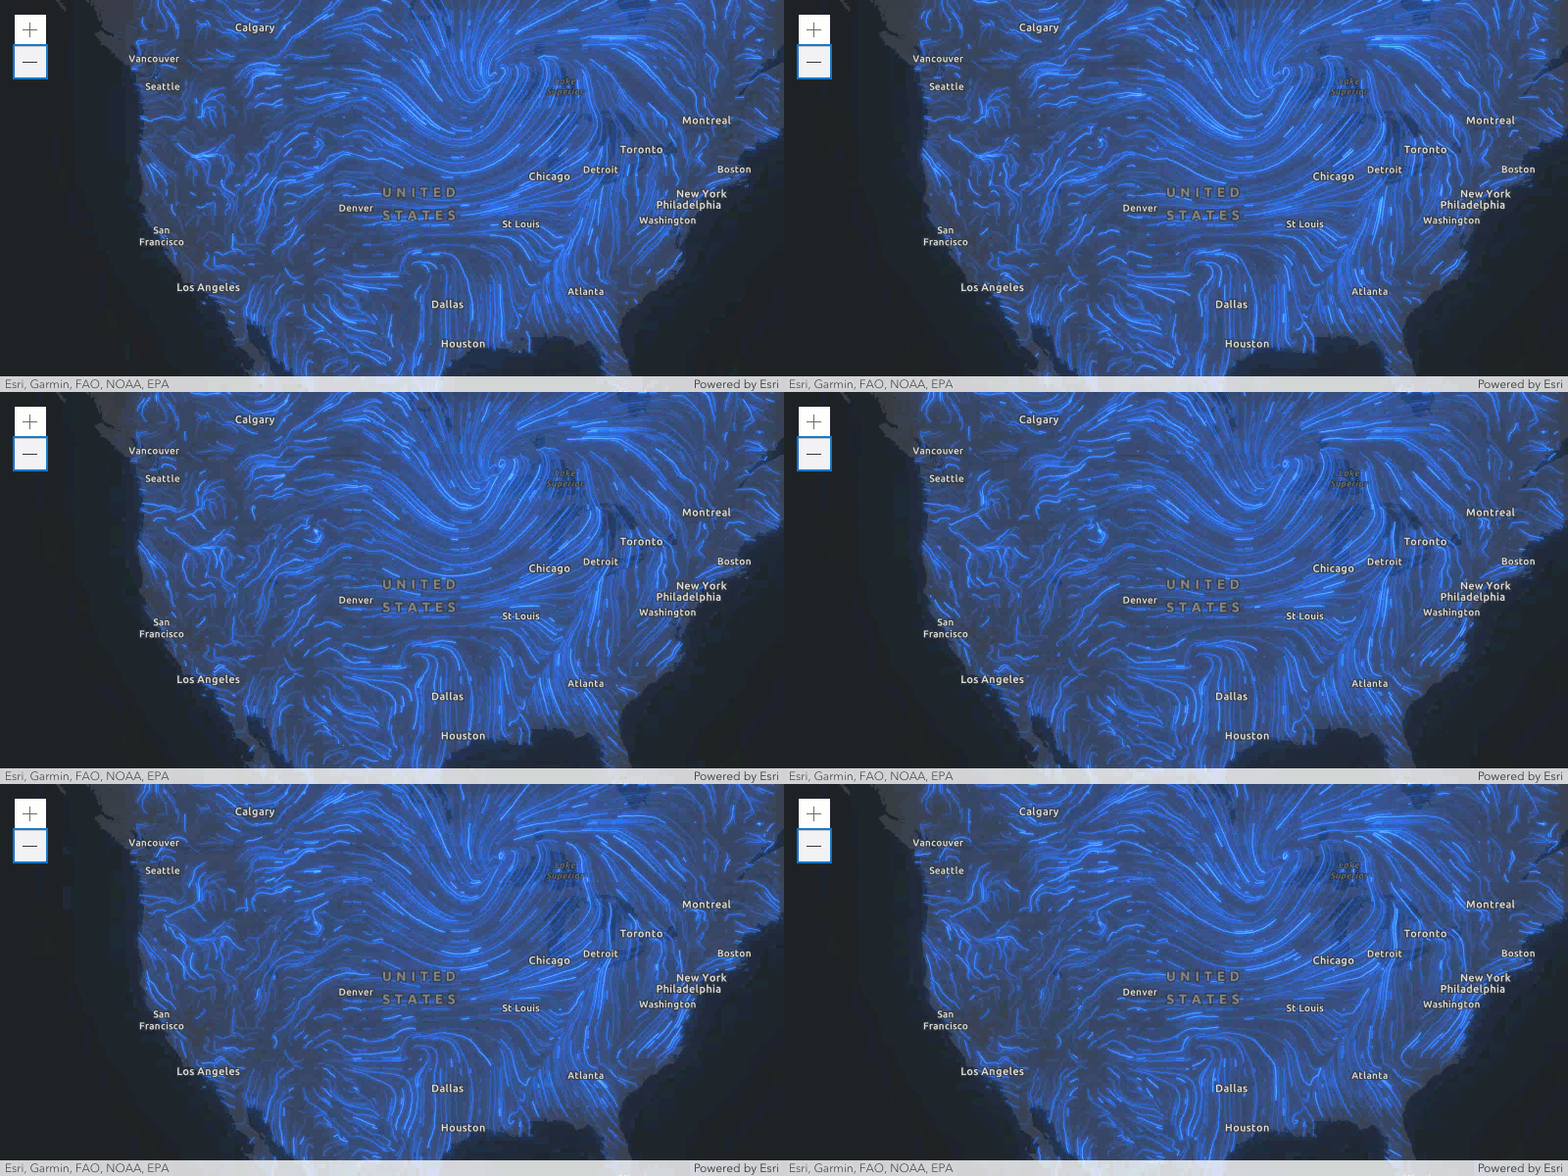
This vector field imagery layer contains magnitude and direction variables, and the map displays wind data using the new Animated Flow Renderer in JavaScript; see this for more information.
How to prepare data for visualization
Wind and ocean current data is often stored in netCDF, GRIB, or HDF format, either as a single file or multiple files. There are a few ways to prepare a layer with the vector field from the data, depending on which product you use. The key is the Vector Field raster function, which composes the two variables that describe speed and direction into a two-band raster with a vector field type. The type is Vector-MagDir if the two variables represent magnitude and direction, or Vector-UV if the two variables represent U and V components. The recommended workflows of preparing data in ArcGIS Pro, ArcGIS Image for ArcGIS Online and ArcGIS Enterprise are outlined below.
Prepare data using ArcGIS Pro
You can create a raster layer of the vector field and visualize it in ArcGIS Pro, or prepare a dataset with the vector field, and publish a vector field-ready imagery layer from it in ArcGIS Online and ArcGIS Enterprise.
Workflow 1: Create a vector field layer directly from the data
You can use the following workflow if the two variables are in one multidimensional raster file, such as a netCDF, HDF, GRIB, or CRF file:
- Click the Add Data button and choose the Add Multidimensional Raster Layer tool.
- Check the check boxes for two variables that represent magnitude and direction (or U and V components).
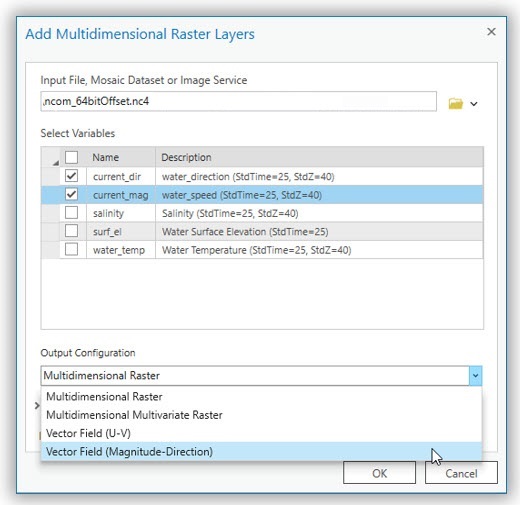
- Choose an option for Output Configuration. In this example, it is Vector Field (Magnitude-Direction), as indicated above. Define the corresponding variable type, as shown below, and click OK to create the layer.
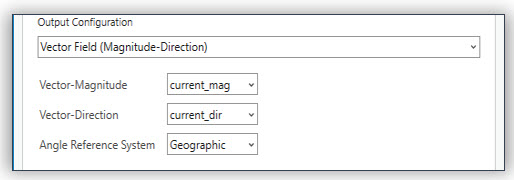
A layer with Vector-MagDir type will be added to the map and it will be displayed using the vector field render by default. You can also save the data to a vector field-ready Cloud Raster Format (CRF) using the Copy Raster tool.
Note: This layer is a function raster layer containing a Vector Field raster function. You can also add the two variables to the map and create a layer using the Vector Field raster function. If the two variables are stored in two files, you can also use this workflow, adding the two variables as two separate raster layers to create a layer using the Vector Field raster function.
Workflow 2: Create a dataset of vector field type from multiple files
When your data is stored in multiple files, you can use a mosaic dataset and a vector field processing template to create a vector field-ready dataset. Here, we use NetCDF files as an example to outline the workflow:
- Create a mosaic dataset using the Create Mosaic Dataset geoprocessing tool.
- Open the Add Rasters to Mosaic Dataset tool and for Raster Type, choose NetCDF. If your data is in other formats, you can choose an appropriate raster type here.
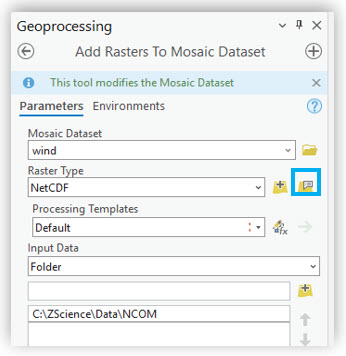
- Set the input path containing your data and click the Raster Type button (blue box). The Raster Type Properties page appears.
- On the page, click Variables in the left panel and select two variables in the right panel, then define the type for each variable; in this example, it is U and V. Next, click Processing in the left panel and choose Vector Field.
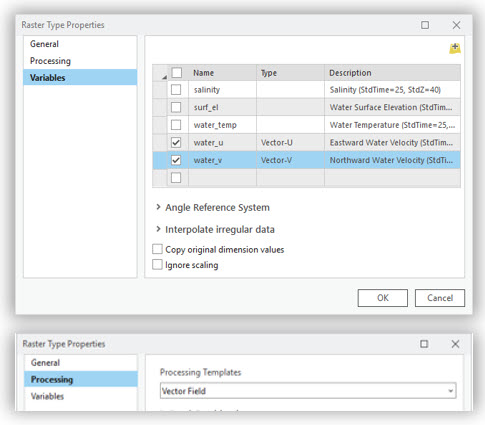
- Click OK to add data, and a mosaic dataset will be created with a Vector-UV type.
- For better display performance, you can convert the mosaic dataset to CRF format using the Copy Raster tool, and this output CRF will have a Vector-UV raster type.
Create a vector field imagery layer in ArcGIS Online
There are two ways to create a vector field imagery layer in ArcGIS Online: One is to first create an imagery layer from the source files containing the two variables, then create a vector field imagery layer by composing a function template and running raster analytics. The created imagery layer will have either a Vector-UV or Vector-MagDir type. This workflow is entirely web based and requires that you have image analysis privilege. The other method is to use ArcGIS Pro to create a vector field dataset, such as CRF, from which to create a vector field imagery layer directly in ArcGIS Online. I recommend you use this method if you have ArcGIS Pro, because it will upload only the two required variables in ArcGIS Online which saves storage, and you can publish it directly without having to run raster analytics which requires image analysis privileges.
Workflow 3: Create a vector field imagery layer from source files
You can create a vector field imagery layer directly from the source files, such as data in netCDF, HDF, GRIB, or CRF format. Before you start, make sure your account has the ArcGIS Image for ArcGIS Online user type extension license with hosted imagery publishing and image analysis privileges. Refer to this help topic for information about privileges to publish a hosted imagery layer, as well as the choice of tiled or dynamic imagery layers.
To create a multidimensional imagery layer, complete the following steps:
- Click the My Contenttab and click the New item
- Choose the Imagery layer option to open the Create Imagery Layers
- Choose the Tiled Imagery Layer Both tiled and dynamic imagery layers are supported for visualizing vector field data.
- For the layer configuration option, choose One Image if your data is stored in a single file, or choose One Mosaicked Image if your data is stored in multiple files.
- In the Select input imagery box, click Browse or drag your files or the whole CRF folder into the box.
- Click Next to define your layer name, tags, summary, and folder to save.
- Choose Create to start layer creation.
It will create a single imagery layer with all the variables available including the two variables for the Vector Field raster function in the next step.
Note: If the data is stored in two separate raster files, you can create two layers by going through the workflow steps above twice.
To create a vector field imagery layer, complete the following steps:
This will take the two variables in the imagery layer in the previous step, and create a vector field imagery layer using the Vector Field raster function. Use Map Viewer Classic if the Raster Function Editor is not yet available in the standard Map Viewer.
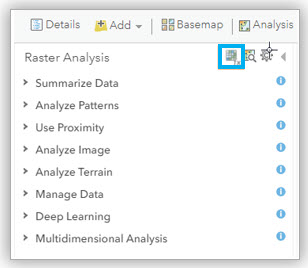
- Open the multidimensional imagery layer created above in Map Viewer Classic, click the Raster Function Editor button (in blue box).
2. In the Raster Function Editor, search for the Multidimensional Filter function and Vector Field function in the System category and create a function chain the same as the one in the following diagram. You can save the raster function template, or directly bring it to the Raster Analysis pane without saving. Click OK to continue and prepare for raster analysis.
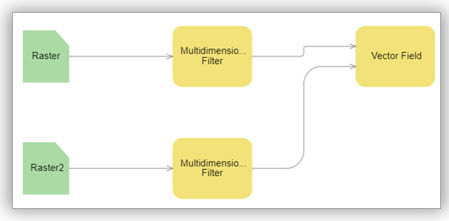
Note: If U and V (or Magnitude and Direction) are created in two separate imagery layers, Match Variables option in Multidimensional Rules needs to be unchecked. Multidimensional Rules are located in Edit Properties, the first button at top-right corner of the Raster Function Editor.
3. Define the input parameters for the template.
a. In the first Multidimensional Filter function, select the first variable, for U or magnitude.
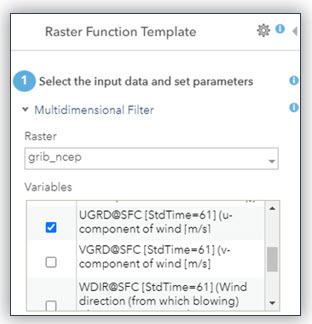
b. In the second Multidimensional Filter function, select the second variable, for V or direction.
c. Choose an option for Input Data Type from the combo box. It is either U-V or Magnitude-Direction; make sure the type matches the selected variables. And define the Output Data Type to be Magnitude-Direction.
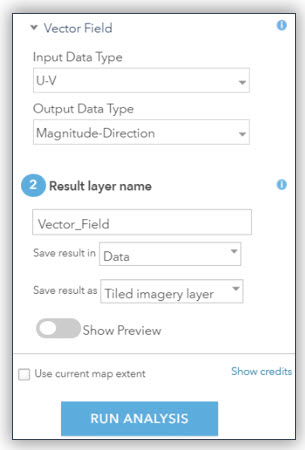
d. Provide an output name and click Run Analysis to the create imagery layer.
The output will be a vector field-ready imagery layer.
Workflow 4: Create an imagery layer from a vector field-ready CRF
Sometimes you may have a CRF with a vector field type created in ArcGIS Pro. You can create an imagery layer from this CRF using the first portion of workflow 3 above, described in the ArcGIS Online workflow section. The layer created will be vector field ready.
Publish an imagery layer for ArcGIS Enterprise
To publish a vector field imagery layer for ArcGIS Enterprise, you can either publish from your portal or publish using ArcGIS Pro.
Workflow 5: Publish from your portal
To publish from your portal, first make sure your ArcGIS Enterprise has image server configured as a hosting server, then create an imagery layer from your data in your local folder or in a user-managed data store. The workflow is the same as the workflows described in the ArcGIS Online workflow section. You can also learn more about publishing hosted imagery layers here.
Workflow 6: Publish an imagery layer from ArcGIS Pro
To publish an imagery layer from ArcGIS Pro, you will need to create a mosaic dataset or CRF file from the data using the same workflow 2 described in the ArcGIS Pro workflow section. When the mosaic dataset is created, right-click the dataset in the Catalog pane and choose Share as Web Layer to publish. See Publish an image service from ArcGIS Pro for more information.
Summary
With these workflows, you can create informative maps to visualize your vector field data using ArcGIS Pro, publishing a service in your organization’s portal, or creating an imagery layer in ArcGIS Online. Have fun creating your maps!




Article Discussion: