In September 2018, the ArcGIS API for JavaScript (JS API) added support for generating age visualizations with the Smart Mapping modules. In this post, age refers to the time elapsed between two dates. I’ll demonstrate several examples of this.
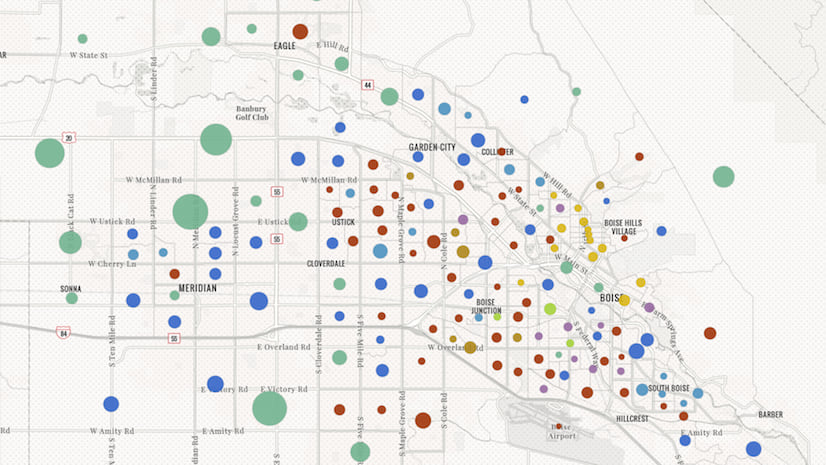
Mapping age can be useful for any layer with at least one date field. For example, you may want to visualize the age of assets or the time elapsed since their last maintenance inspection. Check out the following app, which visualizes streets in Minneapolis, Minnesota based on the time elapsed since their last inspection.
The renderer used to visualize this is generated with the createAgeRenderer method in the color smart mapping creator module. Simply provide a layer, basemap, and the field name recording the time of the last inspection, along with the MapView instance as parameters of the method.
const ageParams = {
  layer: layer,
  view: view,
  basemap: map.basemap,
  startTime: "INSPECTION_DATE",
  endTime: Date.now(),
  theme: "above-and-below"
};

const rendererResponse = await colorRendererCreator.createAgeRenderer(ageParams);
layer.renderer = rendererResponse.renderer;
This method determines the best temporal unit (e.g. years, months, weeks, days, and hours) to use as the basis of the visualization based on the average age returned from the given field or fields. If you’re already familiar with the data, you can specify your own unit. Otherwise, the renderer will determine the most appropriate temporal unit. In this example, years is used because the average age of the features is relatively high.
The method then generates an Arcade expression that calculates the difference between today’s date and the date of the final inspection. It uses the result of the expression to calculate statistics, which are then used to map colors to data values that make sense for the initial visualization.
The final Arcade expression looks like the following, which I logged in the console of the application.
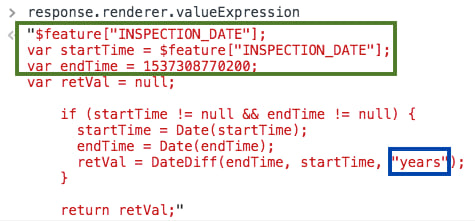
The key part of the expression generated by createAgeRenderer() is the DateDiff() Arcade function, which subtracts the endTime parameter from the startTime using the parsed time unit. You can use this same expression in a renderer you construct on your own, or even in the ArcGIS Online Map Viewer.
DateDiff($feature.INSPECTION_DATE, Date(1537477651175), "years");
What the createAgeRenderer() method does for you is construct the expression on your behalf so you don’t have to worry about writing Arcade syntax.
Subtract two date fields
Rather than calculate age between a date field and today’s date, you can also pass a second date field to the endTime parameter to visualize how long it took to accomplish a particular task. In the snippet below, for example, the output renderer will indicate how many days overdue an incident was resolved passed the due date.
const ageParams = {
  layer: layer,
  view: view,
  basemap: map.basemap,
  startTime: "DUE_DATE",
  endTime: "COMPLETED_DATE",
};

const rendererResponse = await colorRendererCreator.createAgeRenderer(ageParams);
layer.renderer = rendererResponse.renderer;
When you don’t have date fields
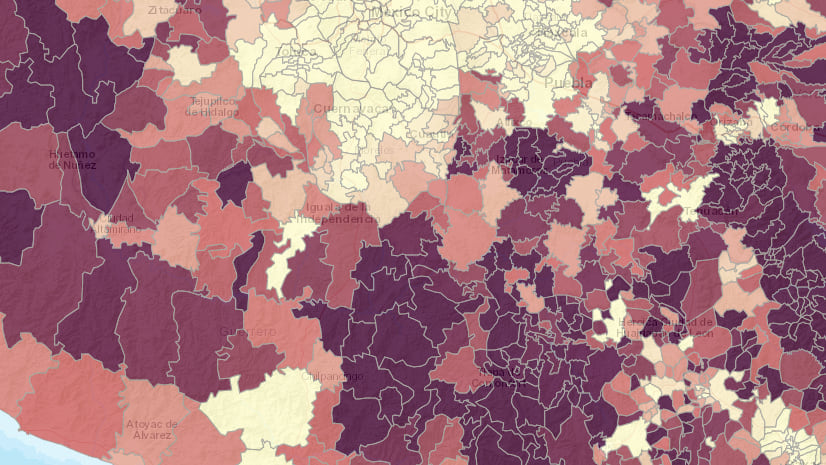
The createAgeRenderer only supports date fields. You can, however, still use the createContinuousRenderer method on either the color or size renderer creator modules to create an age visualization with that data. You just need to construct the Arcade expression yourself, casting the numbers to dates as necessary, and pass it to the valueExpression parameter of the method. See the example below, which visualizes the age of buildings in New York City based on a numeric field for the construction year of each building.
const ageParams = {
  layer: layer,
  view: view,
  basemap: map.basemap,
  // subtracts the current year from the construction year
  valueExpression: "Year(Date()) - $feature.CNSTRCT_YR",
  theme: "above-and-below"
};

const rendererResponse = await colorRendererCreator.createContinuousRenderer(ageParams);
layer.renderer = rendererResponse.renderer;
The createAgeRenderer method exists on both the color and size renderer creator modules. Keep in mind this method is particularly useful for data exploration apps where data is likely to change frequently or users are seeking to gain familiarity with unknown data.
This and other smart mapping modules allow you to generate complex visualizations with minimal code. However, if you intend to share your work amongst various apps, then our recommendation is to create web maps and web scenes authored in ArcGIS Online with the built-in smart mapping tools. They are built using the same Smart Mapping modules described here and in the JS API documentation.


Commenting is not enabled for this article.