Our July updates to the ArcGIS API for JavaScript versions 4.8 and 3.25 are now available and are packed with more ways to visualize your data and enhance your web apps with new capabilities. As with all 4.x releases, 4.8 is a balance between a fresh take on features already available with 3.x, and new innovation. The new capabilities include labeling of feature layers in 2D, enhanced underground navigation in 3D, faster feature layers, sketch updates and more! Here is a quick look at some of the highlights of the release.
More ways to visualize your data in 2D
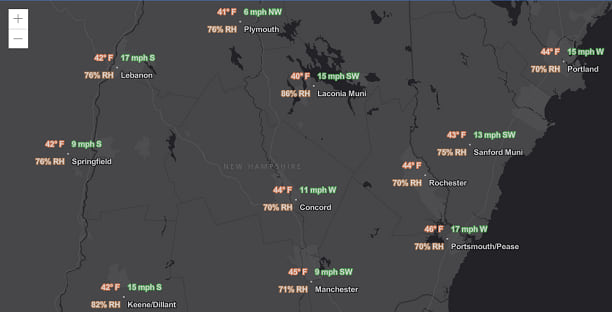
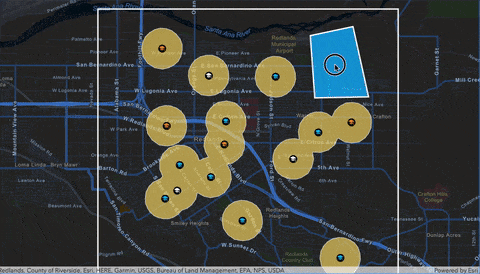
Labeling for 2D. We’re excited to announce that Labeling is now supported for WebGL-enabled point and polygon FeatureLayers, and CSVLayers in 2D maps. You can calculate the label with an expression, define symbols, scale ranges, and label placement, all within a LabelClass. As shown in the sample below, more than one LabelClass can be used to label features, so each feature can have multiple labels with different pieces of information.
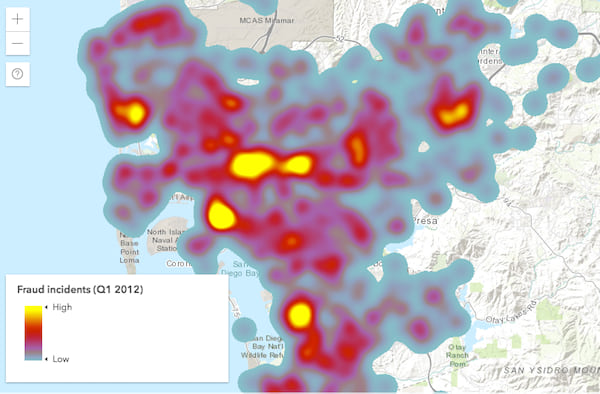
Heatmap renderer. Heatmaps are now supported using the HeatmapRenderer. Heatmaps help visualize large, dense point datasets as a continuous surface, which can be weighted with data values. Heatmaps can be brought into your app via your web map, or created directly in code.
Feature layer evolution: better and better
With faster feature layers, optimized querying, and a growing collection of client-side processing capabilities that enable rapid interaction and analysis, the API allows you to build very dynamic, interactive apps with optimum performance. Each release over the last two years has included enhancements to the FeatureLayer, and version 4.8 is no exception.
Full client-side query support. 4.8 brings full support for layer view queries on the client including: spatial queries using all types of spatial relationships, querying with a buffer distance, and the ability to use expressions for fields and calculating statistics.
Binary format for queries. For optimized query response time, data is now requested by default in a Protocolbuffer Binary Format (PBF) for ArcGIS Online hosted services and it is planned to be included in a future release of ArcGIS Enterprise. This new approach provides performance gains by reducing the HTTP response payload size.
3D improvements
Earlier this year we introduced some exciting new capabilities such as 3D web mobile support and edge rendering in Scene Layers. 4.8 further expands what you can do in 3D, including:
Interact with larger point datasets. Previously, developers working with FeatureLayers in 3D were limited to displaying a few thousand features. 4.8 is a game changer because it maintains a high level of performance with hundreds of thousands of points in a feature layer. We’ve combined performance gains from PBF-enabled feature layers with improvements inside the API. Point scene layers also display significantly more points and allow for much faster interaction.
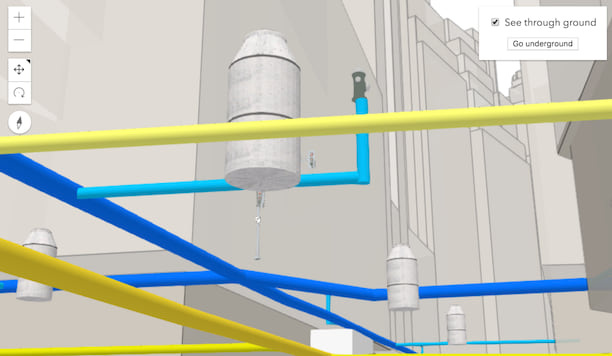
Underground navigation in global scenes. Until this release, underground navigation was limited to local scenes. You can now view and navigate subsurface data in global scenes. The ground can also be made partially transparent, allowing users to see through the ground surface and reveal underground features such as seismic measurements or utilities infrastructure.
Furthermore, the new ground color property lets users define how the earth surface displays below the basemap.
Custom background color in global scenes. You can now set your own background color for global scenes. Use this custom background color to remove the sky and stars and make your cartographic style really pop! Also, the background color is a great styling option if you want to embed your scene in your web site or blog as the scene will match the styling of your page for a cool effect… (Like the embedded scene below…try it out right here in the blog!)
For more ideas on bringing these concepts together in 3D, and to learn how the globe shown above was created, be sure to check out this blog post: Get creative with globe visualizations.
The road to full sketch support: important updates
4.8 introduces scaling and rotating for existing graphics in the SketchViewModel. We’ve added new events to help give you better control over the sketch life-cycle. You can use these events to do things like execute real-time geometry validation during graphic creation or while it’s updating.
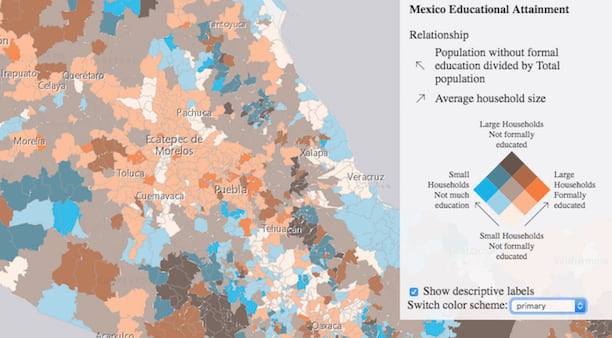
3.25 Relationship Renderer
SmartMapping in 3.25 includes a relationship renderer which allows you to map patterns within a single map and help you see if two things are related. This is done using a technique known as bivariate choropleth mapping, where two color ramps combine into a grid-like legend showing all pattern combinations. Learn more about creating maps that explore relationships between layers. Web maps that contain layers with relationship rendering can also be read in 4.8.
There’s more
The Bookmarks widget is now available, allowing users to easily navigate to areas of interest in 2D maps by clicking on the bookmark name or thumbnail.
Be sure to check out these blog posts for other exciting recent developments:
- Introducing a CLI for the ArcGIS API for JavaScript
- Using the new webpack plugin for the ArcGIS API for JavaScript
For a full list of enhancements, breaking changes, and bug fixes be sure to check out the release notes:
- Version 4.8 release notes and samples
- Version 3.25 release notes and samples
Come see us at the Esri User Conference in San Diego!
The ArcGIS API for JavaScript team would love to see you at the Esri User Conference in San Diego July 9th – 13th. Come introduce yourself at one of our sessions or stop by the Web Development showcase. Check out our Web Development Session Guide to help navigate web development-focused technical sessions.


Commenting is not enabled for this article.