For an interactive version of this blog click here.
Vector Tile Layers are used to create multi-scale maps that are efficient, high-resolution and customizable. Since they became available the Esri Living Atlas Content Team has built vector tile versions of most of our traditional basemaps, plus some new ones. And we had the opportunity to play around with them as well! We created a series of custom basemaps that exploit various graphic effects:
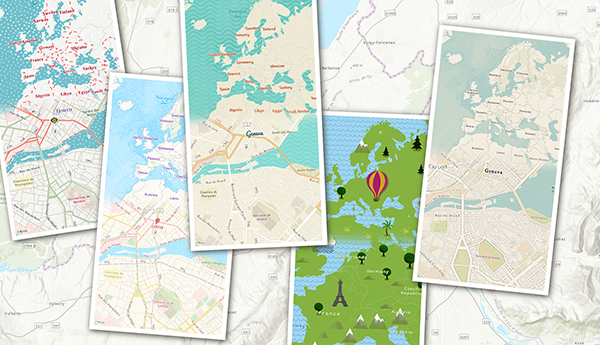
You can change our maps as well. The Vector Tile Style Editor is making this work increasingly easy (see below), but there are still some limitations, and you may prefer to build your own basemap. For that, you need to go back to first principles …
What are we building?
A published Vector Tile Map works best as a foundation. You cannot link to data from a Vector Tile Layer, so you should set it below (or possibly above) any interactive information that you’re building. Let’s call it a ‘basemap’ (which is what we build for ArcGIS Online), but it doesn’t have to be just that.
The simplest way of exploiting Vector Tiles is to work online with copies of our basemaps. You can change colors, lines, symbols and to some extent fonts. The fonts available have to be defined in the published Vector Tile Package, so we have added a few extra to our master tile set.
The focus here though, is on taking the customization to another level, and that requires you to build your own map from original data.
With What?
Find a data source. Remember that you are building a map that will support your subject, so you are most likely looking for different levels of relevant geographic information. The map will be established in ArcGIS Pro, exported to a vector tile package, then published as a vector tile layer.
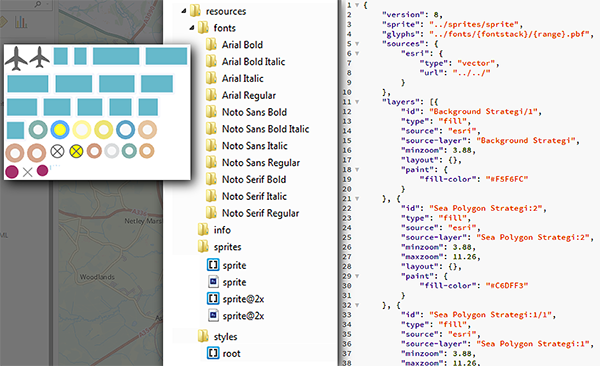
A vector tile package contains the vector tiles, and various formatting documents (In essence, the package is a zip file, so you can use an ‘Extract files’ command to ‘unzip’ it and look at the contents). Of interest to us is the Resources Folder, which includes:
- Fonts – Any font that is built into the ArcGIS Pro map.
- Sprites – Raster images created for special effects, such as textured patterns and point symbols. Once these have been exported from Pro, they are not editable.
- Styles – A root.json file that establishes the symbolization of the rest of the map. This is editable!
For more information on working with our maps, see here for step-by-step instructions, and here for some thoughts on designing basemaps.
What else do I need?
A graphics/drawing program. This doesn’t need to be anything fancy. If you use Adobe Creative Suite, Corel or similar you’re in great shape, but there are plenty of simpler apps available that will do the job.
A text editor. You may be planning to set up the final look of the map in your Pro document, but the chances are that you’ll need to ‘tweak’ something in the published style json, and you may be planning to build more than one style from the published service. Either way, you will need to access the code in the style json. A simple text editor may be enough (we use ‘Adobe Brackets’, which is available as a free download)
Alternatively you can use one of our editing apps:
The ArcGIS Vector Tile Style Editor is available when you use the ‘change style’ option in your basemap tile layer (It can be accessed outside of ArcGIS online here. It is an intuitive app that leads you through most of the changes you can make to the style.
The JSON Code Editor is a beta app that can be found here. It has to be opened separately, but it will help you to navigate to the layer you want to work with. It pairs the JSON style with a preview map as an easy way for you to work directly with the code and see the results.
Most of all, you need imagination! Even if you are building a map to support an earnest, worthwhile and impactful point, you can still try to do something a bit different with it, and you may be able to have some fun!
I’m using a map of Great Britain to illustrate some of these techniques. It was created with UK Ordnance Survey Open Data, and it was shown at the 2017 Esri User Conference to demonstrate building vector tile maps in different projections (It uses the OS Modified Transverse Mercator projection). This version uses custom symbolization that I’ve prepared for this blog.
Working with Fonts
Any font that is included in your ArcGIS Pro document will be carried over into the Resources Folder, whether you are using it or not. This means that some discipline is required.
If you are building a one-off map then you can add any licensed or open source font that works for you. But don’t get carried away – you don’t want the map to look like a Victorian circus poster! A rule-of-thumb is to limit yourself to two faces (Arial, Times, etc.), but as many fonts (Bold, Italic, etc.) as necessary.
For the Great Britain map, I used one of the faces we make available in Esri Basemaps: Noto. In fact it is a compatible pair of faces – Noto Sans and Noto Serif.
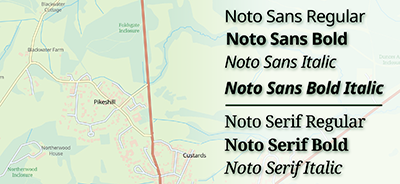
If you are planning more than one map, try to include the fonts that you’ll need across the whole set, by adding them to non-critical layers …
… but take a good look through your layers before publishing. Make sure you don’t leave any unused fonts behind by mistake. It won’t break the vector tile service, but you want to be as efficient as possible.
Working with Sprites
Sprites are used to create any point symbol, be it a city dot, the base for a road shield, a pictorial symbol or something else. They are also used for creating patterns – any fill or line that requires more than just a flat color.
This is one of two generated Sprite files (at 96ppi and 192ppi) for our Street Map:
![]()
Note how road shield backgrounds dominate this file, not surprisingly for the Street Map. The shield symbols need to accommodate multiple shapes and colors, and different lengths of text string, so there is more than one version of each. However, don’t miss the city dots at the bottom or the two transit symbols near the bottom left.
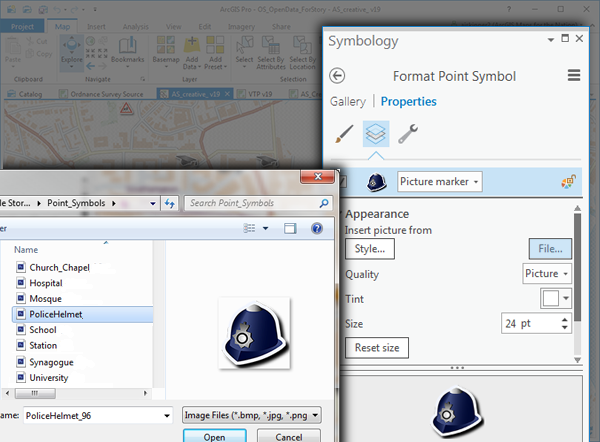
Creating Picture Markers
Any marker symbol that you create in your ArcGIS Pro document will be converted to sprites automatically.
Custom or pictorial markers are easy to build with a graphics package. Have a look at ‘ A Children’s Map’, a vector tile map created by Esri’s Wesley Jones (Zoom in and see if you can find the Sasquatch!). All of the pictorial symbols were hand drawn, and imported as PNGs.
JPG and PNG format both work, but PNG (left) is preferable because you can use the transparent setting. A non-rectangular JPG symbol (right) will have a white box around it.
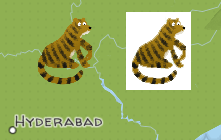
Resolutions can vary, but a good practice is to build the original at 96 ppi and at twice the size of the final symbol. Sprite files are generated at two sizes, 96 ppi and 192 ppi, so this will accommodate both circumstances.
For my map of Great Britain, I created a series of icons to be used at large scales. I added a shadow to make them stand out more clearly against other features, and a white, partially transparent, ‘halo’ on the Rail Station dot to break it out of the line:
![]()
Markers are imported to the map using the ‘Picture Marker’ option in Symbology/Properties. Once there, the ‘Reset Size’ button will set the symbol to the optimal size for viewing based on its resolution, but you will probably want to make adjustments up or down.
Creating Patterns and Textures
This requires a little bit more thought.
Have a look at the ‘Colored Pencil’ basemap created by Esri’s Cindy Prostak. She used a series of textured tiles (sprites) to give the map a ‘hand-drawn’ finish. But the structure of this map is misleading – the ‘hand-drawn’ nature gives the map a casual and informal feel, but a lot of preparation and planning was required to achieve this look successfully.
The concept is simple, and if you are a regular user of graphics packages such as Adobe Illustrator you’ll be familiar with it – A patterned tile is repeated as many times as is required to fill a polygon, and is masked by it:
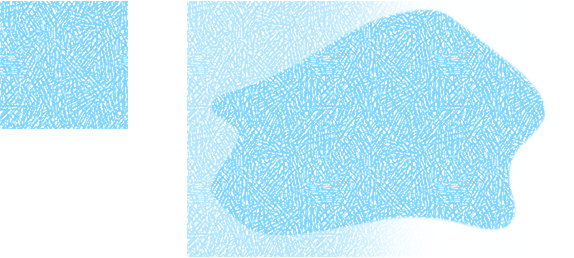
The reality is a bit more complicated. Let’s look at a simple hatched pattern from the Topographic Basemap (Note that the ‘line fill’ tool in ArcGIS Pro does not translate to vector tiles, and that means that hatched patterns must be prepared graphically). The tiles repeat the hatch across the whole shape. However the edges of the tile must join perfectly:

In the bottom row I have deliberately cropped the tile to demonstrate what can happen. Even a fractional difference from one side of the tile to the other will create an edge. More complicated patterns need to be built with the same concept in mind.
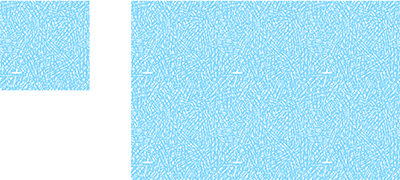
‘Random’ patterns like the colored pencil tile are sometimes more complicated to build. Any unevenness across the tile may be seen in the final result. Here, I removed a few pixels from the bottom-left of the water texture. It’s hardly noticeable on the tile, but when applied it can be seen clearly as a repeating pattern.
For my map of Great Britain, I created two tiles.
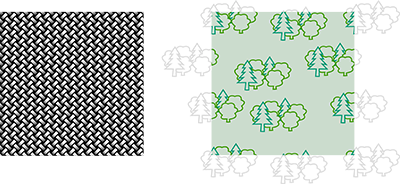
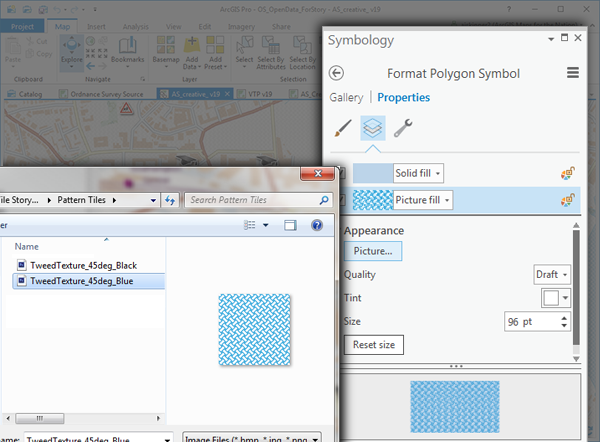
One applies a fabric effect across the map (with a separate version in blue for water). I set colored fills over the top of both, and applied a high degree of transparency to merge them into the background.
The second adds a cartoon-style pattern to woodland. Notice how the woodland pattern aligns and repeats. I exported them to PNGs at 96 ppi.
Tiles are added as a Picture Fills in ArcGIS Pro. Once established they can be reduced or enlarged, but keeping them at the same size will make the final effect more predictable. Keep the tile size down if you can, and don’t go above 512 ppi.
Don’t expect to get your symbols right first time. I made 3 or 4 attempts at both of these patterns before I was satisfied
Creating and Publishing Vector Tiles
There are two ways of publishing the map:
Share Directly: Use ‘Share/Web Layer/Vector Tile Layer’. In one action, this will create a temporary vector tile package on your computer, then move it to your organizational account and publish a map service.
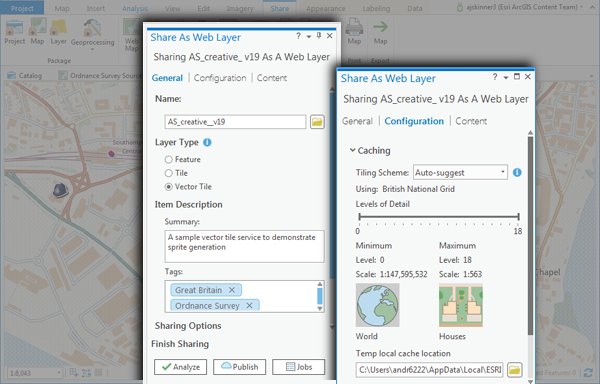
My map, which includes data for the whole of Great Britain at multiple scales, took about an hour to run.
Create a Vector Tile Package Locally: This is a 3-step process, but it has the advantage of allowing you to check how well your symbols are working before committing the map to your online account.
Use the ‘Create Vector Tile Package’ tool
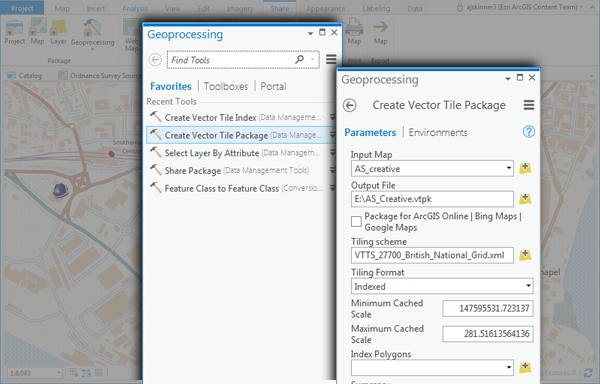
This will create a vector tile package on your computer. The package can be loaded back into ArcGIS Pro for checking (using ‘Add Data’). This is useful if you are working with Sprites – You can check how they translate to the Vector Tiles before you commit to final publication (although ArcGIS Pro doesn’t render them in precisely the same way). The package for this map takes about 45 minutes to an hour to run.
Note: A ‘Vector Tile Index’ added in the ‘Index Polygons’ field above, is an optional process you can use to improve the efficiency of a Vector Tile Service, and it is recommended. However, because I was building this map in a projection other than Web Mercator, this was not available to me. You can find more about Vector Tile Indexes here.
Once it is ready, use the ‘Share Package’ tool to move it to your organizational account. Click on the package in your ArcGIS Online Contents folder, and it will give you the option to Publish the service.
Final Results
Have a look again at my final published map with patterns in place. Zoom-in to see the new point symbols.
![]()
This is the sprite document that was generated to support my new symbols. It includes my pictorial symbols and tiles, as well as exit number boxes, and roundabouts / interchanges generated from conventional marker symbols.
If necessary, you can make changes to the published sprites (or add new ones) within any map derived from this tile layer, using the Vector Tile Style Editor. However those changes will not be added to this core set.

Commenting is not enabled for this article.