Introduction
Sampling design is a critical part of any study involving modeling and estimation based on data that is sampled from natural resources or other phenomena occurring in the landscape. Statistical considerations related to sampling are part of a larger scenario involving theoretical knowledge, previously detected behavior and patterns of the phenomenon, costs, accessibility to sample sites, politics, and so forth. Thus, the sampling design algorithm should be flexible enough to accommodate external considerations in the design. Currently, ArcGIS offers a number of different methods which include, Create Random Points, Create Random Raster, Create Spatially Balanced Points and Densify Sampling Network geoprocessing tools. Some of these methods can be used to design a new monitoring network and others can be used to add or remove monitoring sites from an existing monitoring network.
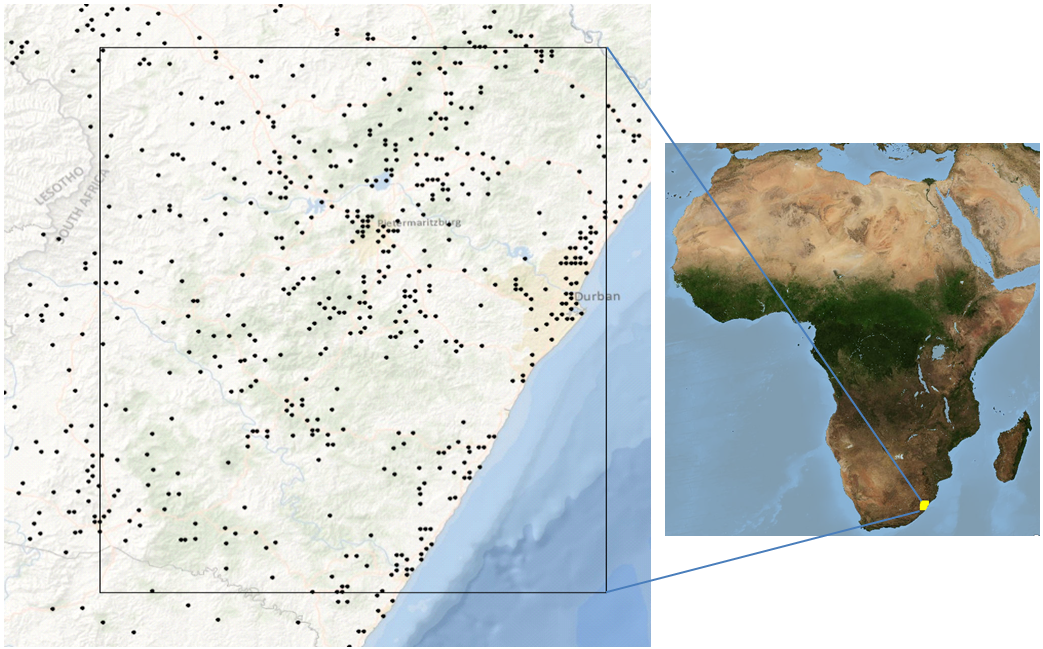
In this blog we’ll use the Densify Sampling Network geoprocessing tool to identify locations for new rainfall monitoring sites for an area on the east coast of South Africa. We want to find out where to place additional monitoring sites so that the mean annual precipitation surface created by interpolation can be improved. One can randomly suggest new locations in areas that are void of monitoring sites, however, these might not be locations that will yield a more reliable output prediction surface.
Workflow
The Densify Sampling Network tool requires an existing monitoring network with measurements at known locations. Prior to running the Densify Sampling Network tool one needs to create a kriging geostatistical layer which can be done via the interactive Geostatistical Wizard or the Empirical Bayesian Kriging geoprocessing tool (new in ArcGIS 10.1).
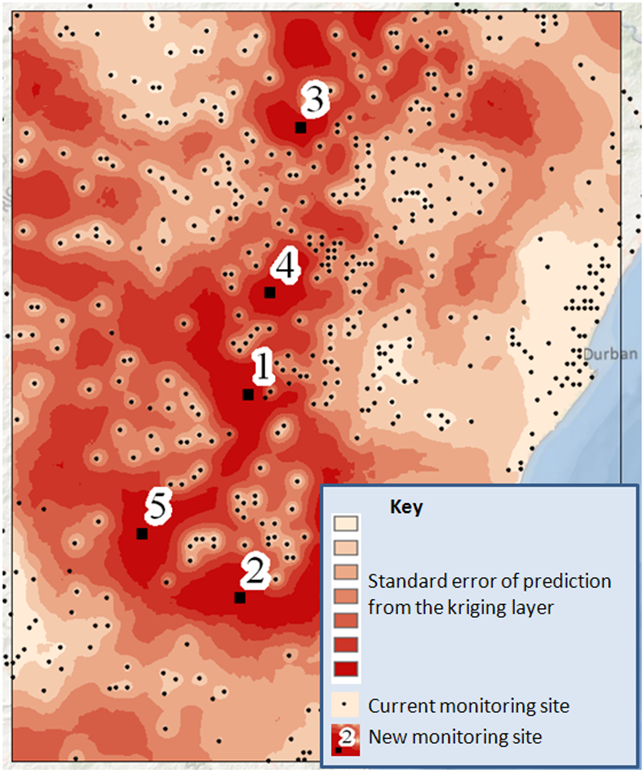
For this example our new site selection criteria will be the standard error of prediction surface, associated with the kriging layer, which will be used to assist in determining where to place the new monitoring sites. An optional weight raster can also be used to give additional preference to the new site locations, in our case it’ll be given a value of one in areas where monitoring sites can be placed and zero’s in the ocean where we do not want to place monitoring sites. Simplistically, the following is done when the tool is executed. The standard error of prediction surface and the weight raster are combined and the location with the largest value is deemed to be the location of the new site. A prediction, using the kriging layer, is made at this location and this value is included in the input feature class of existing monitoring sites and a new standard error of prediction surface is generated. This surface is then again combined with the weight raster to decide where the next location should be. This sequential process is repeated until the desired number of new monitoring sites has been created. An inhibition distance can also be used to ensure that new monitoring sites are not too close to one another. If a proposed new site falls within this inhibition distance the location of the next largest value from the combined standard error of predictions surface and weight raster is selected.
Conclusion
The Densify Sampling Network tool is run using a weight raster, to exclude the ocean (weights equal to zero) from the analysis, and an inhibition distance of 15km is used to ensure that new sites are not too close to one another. As one would expect, the new rainfall monitoring sites are located in the areas which have high standard error of prediction values as determined by the kriging model that we chose as input to the tool. The new sites are determined sequentially, see figure below, and are based on the magnitude of the standard error of predictions and the weight raster.
Acknowledgements
The South African Water Research Commission (2004) is gratefully acknowledged for the mean annual precipitation data used in the example.

Article Discussion: