This blog is the second in a series of articles which aims to demonstrate how the beta release of the ArcGIS Maps SDK for Java (with ARM Linux support) can be used for IoT data recording apps. The first blog of the series walked through how to create an inexpensive GPS logger using the Java Maps SDK with a Raspberry Pi.
The libraries used in this article are available on request by emailing ARM64LinuxNative@esri.com.
Introduction
In this blog, I’ll share how to use the Java Maps SDK to build a simple app that can display and then log weather data gathered from a Raspberry Pi to a feature service. Hosting the data in a feature service allows for automatic uploads of weather data, and allows for further analysis of the data over a longer period of time. This workflow could also be extended to add more weather stations and host their data in the same feature service to build a live weather map.
There are lots of potential use-cases for this type of sensor data recording and logging such as:
- Environmental monitoring for climate change analysis
- River monitoring for real-time warnings of flooding events
- Air quality or pollution monitoring
- Agricultural crop monitoring
Having this data written back into a feature service allows for historical analysis to look for changes and patterns over time, but the data can also be used in a control room dashboard where more urgent actions may be required.

I’m using the Raspberry Pi platform for this blog post series as they are particularly well suited for embedded IoT projects. The Raspberry Pi has a good range of hardware extensions (such as GPS units, weather sensors, cameras) and software libraries making it easy to prototype a wide variety of data collection applications.
A Raspberry Pi can be easily set up as a weather recording station by adding sensors for temperature, humidity, and air pressure. With a little creativeness this could easily be extended to record other environmental information such as windspeed, rainfall or even air quality. The Raspberry Pi platform is well supported with sensors allowing for inexpensive development of IoT applications.
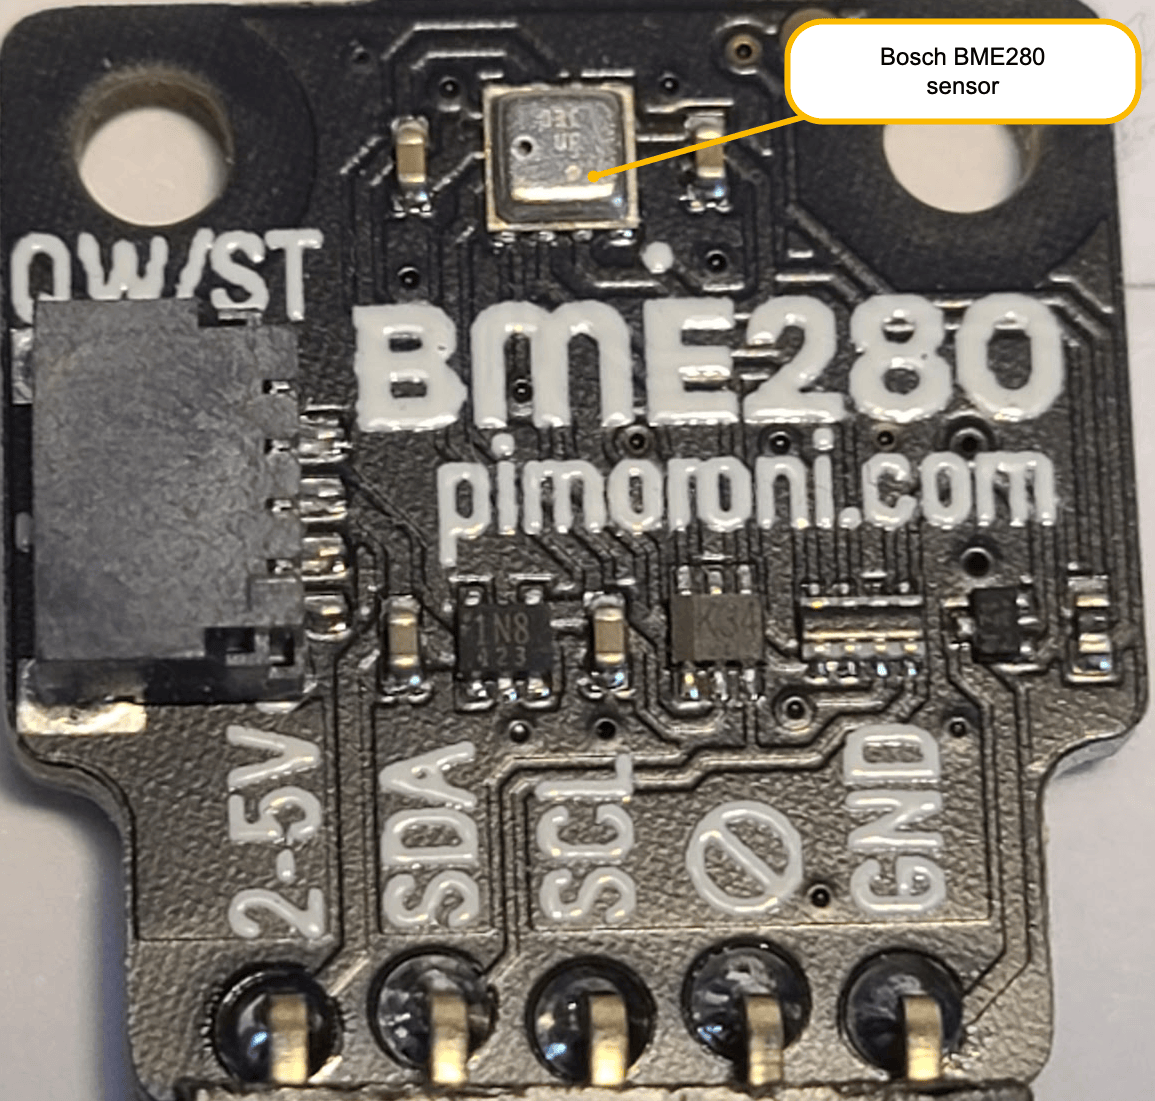
The sensor I’m using in this project is a BME280 made by Bosch which measures 2.5mm square and measures temperature, air pressure and humidity. It is packaged on a PCB made by Pimoroni who made it easy to interface with the Raspberry Pi using the i2c interface.
Setting up the Raspberry Pi
N.B. I have written a full set of software setup instructions for the Raspberry Pi in GitHub repository for this blog.
Parts needed for project.
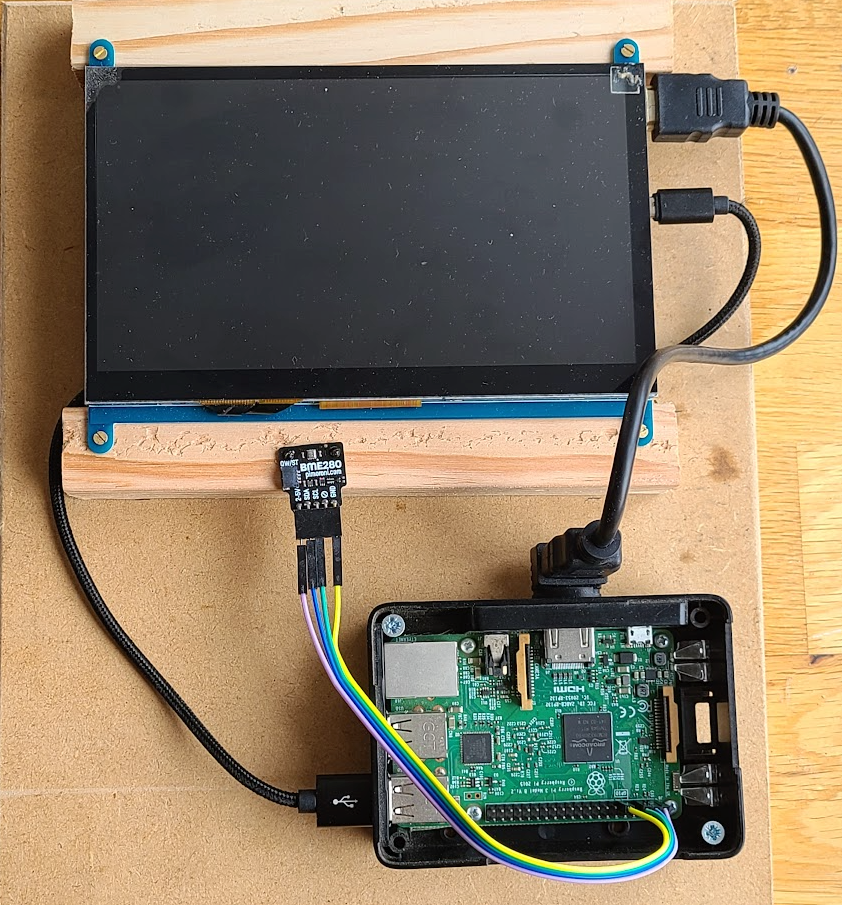
These are the parts I’ve used to make the weather recording station:
- Raspberry Pi Model 3b+ or 4b+
- 7” display (unless you make a headless app)
- Case and power supply
- 16Gb microSD card
- Pimoroni BME280 sensor
- Male to female 0.1” pitch jumper wires
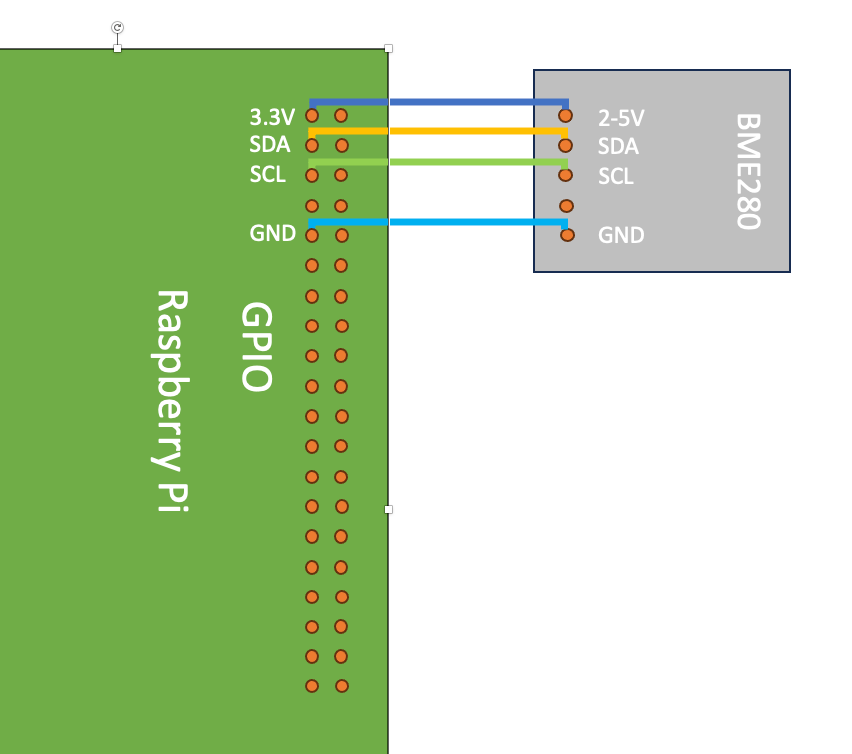
As supplied, the Pimoroni BME280 sensor needs a female right-angle header soldering onto the board, and you need to use the jumper wires to connect to the Raspberry Pi’s GPIO port as shown in the diagram below. The sensor board has been designed so it could be plugged directly into the GPIO port of the Raspberry Pi, but in my view, this will result in elevated temperature readings as the heat generated from the CPU will raise the values. Using short jumper leads will mitigate this problem.
Now we’ve got the electrical connections sorted out (please double check them before you turn anything on) let’s return to the familiar ground of Java development and geospatial data!
Setting up the feature service
To display the data from the Raspberry Pi weather station online, I’ll create a feature service in ArcGIS Online. I’ll do this in ArcGIS Pro and then publish it to my ArcGIS Online account.
I set the feature service up to contain a point feature layer (to record the locations of the weather station), and a related table, using a one-to-many relationship class (to contain the data reports from the weather station). To learn more about creating related tables in ArcGIS Desktop visit the ArcGIS Pro related table guide.
The design for the data is shown in the entity relationship diagram below. Since the weather station sensors are collecting temperature, pressure, and humidity, I have set the attribute names appropriately along with the record date/time stamp

After the Raspberry Pi with the BME280 sensor and the feature service on ArcGIS Online were set up, I used the Java Maps SDK along with the Pi4J and JavaFX Medusa libraries to build a weather station app that displays live information direct from the sensors and writes weather report data directly to the feature service.
The project for this app is in this git repository.
Check out Rachael Ellen’s blog post on using the JavaFX Medusa library to build the user interface of this application.

I’ve assumed that the weather station has network access, so the app is using the Java Maps SDK to write weather report data directly into the feature service.
There will be instances where IoT data collection devices do not have network connection, so offline data collection techniques will be needed. If you’d like to learn how to handle offline data collection, check out my previous blog post where I made a GPS data logger that could collect data remotely and then push data when back online.
Writing the sensor data into the feature service is simple, firstly you need a connection to the service as follows:
// Connect to the service feature table for logging data on public service
reportTable = new ServiceFeatureTable("https://services1.arcgis.com/6677msI40mnLuuLr/ArcGIS/rest/services/Weather/FeatureServer/1");
reportTable.loadAsync();
And once the connection is made, I have a timer in my application which adds the latest sensor data into the service every 30 minutes:
// create attributes for the weather report
Map<String, Object> attributes = new HashMap<>();
attributes.put("WeatherStationID", weatherStationID);
attributes.put("ReportTime", Calendar.getInstance());
attributes.put("Temperature", currentTemperature);
attributes.put("Pressure", currentPressureMb);
attributes.put("Humidity", currentHumidity);

// create the feature
Feature reportFeature = reportTable.createFeature(attributes, null);

// add the feature to the table and apply edits to the feature service
var addFuture = reportTable.addFeatureAsync(reportFeature);
addFuture.addDoneListener(reportTable::applyEditsAsync);
The table below shows an extract of the data I have recorded for my weather station set up in North Berwick on the east coast of Scotland:

You can explore the data in the following web map:
Summary
In this blog, I’ve demonstrated another way of using the beta release of the ArcGIS Maps SDK for Java as an inexpensive IoT data collection project. Using the Java Maps SDK in an IoT data collection device provides a very easy way to write sensor data directly into the feature service for further analysis of your data.
A GIS or geospatial analyst now has the basic data for creating a time aware layer, or maybe even exposing this as a heat map which might help urban planners to know where to plant trees to reduce temperatures such as in this Living Atlas item. The data could also be nicely styled when shown in a web map as discussed in this blog post.
In the next blog post, I will explore the use of the Raspberry Pi camera for collecting image data written into a feature service as attachments. This has lots of potential for use cases such as site security monitoring or nature cameras for example.
If you would like to try these projects out for yourself, please contact us on ARM64LinuxNative@esri.com for access to the beta release of the ArcGIS Maps SDK for Java with Arm Linux support.
Please consider following @EsriDevs on Twitter or subscribing to Esri Community for the latest updates on our products.
Note: Raspberry Pi is a trademark of Raspberry Pi Ltd.
Resident electrical engineer checking the cabling of my projects:


Article Discussion: