
No one’s data is perfect. Modern trends in the industry like AI and Digital Twins have significantly raised the bar on what is considered “good data”. This has many customers looking for ways to help them be more effective in their daily efforts while also being able to support these emerging technologies. One of the drivers for the adoption of ArcGIS Utility Network is that it helps tackle both of these problems. Its improved quality assurance and quality control (QaQc) features help you maintain high data quality, while its advanced capabilities support more sophisticated forms of analysis. When working with a utility network, QaQc is built into every tool and the entire editing workflow. Every edit is tracked, every change is validated, and every error must be corrected. This gives organizations who have implemented ArcGIS Utility Network an unprecedented level of confidence in their data. However, getting data to the point of being clean has been a struggle for many customers because they have to fix decades of mistakes. Mistakes they didn’t know they were making.
The Migration toolset helps address this problem in two separate ways. First, when you create a utility network using the Migrate to Utility Network tool, the model is much simpler and more forgiving of data quality issues. This allows you to fine-tune your model and quality assurance practices over time. Secondly, the toolset includes tools that help you identify and, more importantly, automatically fix data quality issues in your utility network.
Not every organization has the time or staffing to review and resolve all its errors manually. You can use these tools to identify issues that can be safely solved through automation and manually correct the remaining issues. We’ll be discussing the process for identifying and resolving data quality issues in this article, with links to more detailed resources for specific errors. If this sounds like something you’re interested in, read on!

If you’re not already familiar with error management in the utility network, you will want to familiarize yourself with the following resources:
- You can find a full list of all the possible network errors on the Errors page in the online help.
- Read the Feature restrictions and rules page to learn the difference between a network rule and a feature restriction, along with the constraints for what types of features can be connected or associated.
- Read the Dirty area management with the utility network article to learn how the utility network uses dirty areas to track and validate edits made to the network topology.
Analyzing Network Data
The first step of this process is to run the Analyze Network Data tool to identify issues with your utility network data. This tool is designed to identify the most common topological errors found in a utility network. While this tool works best when run against a geodatabase created by the Migrate to Utility Network tool but can be run against any geodatabase that contains a utility network (file gdb, mobile gdb, or enterprise geodatabase). This tool will analyze the data and rules of your utility network and create a geodatabase and layer file to help visualize the results along with a CSV file containing rules that could be added to the model to resolve errors.

Note: If you choose Set default resolution actions the tool will prepopulate the resolution for certain errors like self-intersecting lines and duplicate vertices.
You will find the following items in the output folder:

- AnalysisResults.geodatabase – A mobile geodatabase containing classes with the results from the analysis. The name of the database is set by the Output Name parameter.
- Error Locations – The individual locations in the network where errors were discovered.
- Error Summary – A summary of all the unique combinations of errors in the network. Each combination is uniquely identified by a Group Key.
- Error Records – Information about all the features present at each error location and what kind of error they have, if any.
- Error Resolution – The desired resolution for each grouping of errors.
- AnalysisResults.lyrx – A layer file configured with relationships, symbology, and definition queries to make reviewing the results easier. The name of this file is set by the Output Name parameter of the tool.
- RuleCandidates.csv – A CSV containing any rules that could be added to the model to resolve connectivity errors.
The easiest way to review this information is to add the layer to a map, along with your data from the utility network.
Working with summaries
When you first add the layer to your map you will see different colored points for each of the identified errors in your network. These points are from the Error Summary layer, which includes a default color scheme to assist in reviewing the data.

The Error Summary layer has the following fields:
- Error code – The type of error for those features
- Analysis types – All the features that are found at the location of the error, this gives unique context to an error
- Types in error – The features that have an error
- Source classes – The classes represented by the error
- Asset groups – The asset groups represented by the error
- Asset types – The asset types represented by the error
- Occurrences – How many instances of this error were discovered
- Resolution key – A unique identifier used in the relationship to Error Resolutions
If you select an error summary feature on the map, you will notice that several things happen. First, multiple points will become highlighted on the map. This is because the summary feature represents a collection of errors, and its geometry is a single geometry with multiple points that represent every location in the network where that error is found.

The second thing you will notice is that the corresponding resolutions for this error are automatically selected. This allows you to quickly see whether there is already a fix defined for this error, and if not, you can quickly create one. Once an action has been chosen for the error, you will see it appear in the tree view. You can find detailed descriptions of how to use the resolutions table in the Resolving topology errors found on the Esri Community site.

If you want to see the features that correspond to an error, you will need to turn on the Error Locations layer. Then you can see and select features from the Locations layer. Doing this will automatically select the corresponding features in your utility network.

As you review your errors and identify issues that can be fixed automatically, you may determine that some of the issues require manual cleanup in your source data. If this is the case, then you can add the Locations layer to a map with your source data to help guide your source data cleanup work.
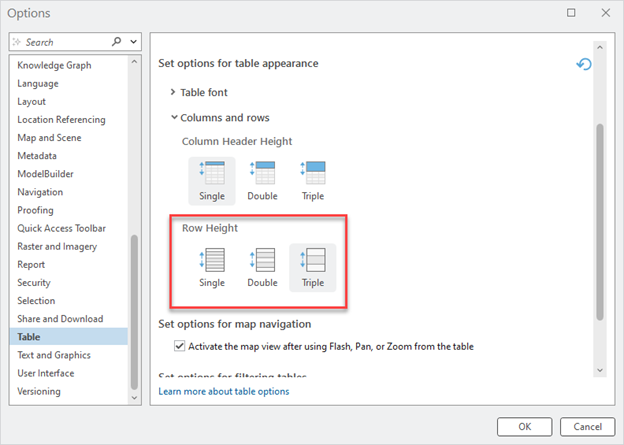
Note: If you’re using the attribute table to review information, consider changing the row height of your table so that you can see all the asset types on an error. To change this, go to Project > Options > Table > Columns and rows > Row Height and set it to triple or double.
The Error Analysis layer also includes several charts you can use to visualize the results of the analysis. The Error Summary layer includes two charts: one shows the number of errors based on their error codes, and the other shows the number of errors for each error code and feature types.

Similarly, the Error Resolutions layer shows you how many resolutions have an action assigned to them. Not every row in the resolution table requires an action assigned to resolve an error, especially if the resolution row is used to provide context.

These charts provide a good start to understanding how many errors you have, but you can always create your own charts to help you drill down to understand specific issues with your data.
Understanding Errors
While reviewing these tables there are certain fields you will find on almost every table: feature type, analysis types, and error code. These fields describe the what, who, and where of each error. Let’s look at these in more detail.
The feature type field allows you to identify the network class, asset group, and asset type of the corresponding feature that is in error. If you’re looking at an error summary, you will see all the types listed in the “Types in error” field. Knowing the asset type of the features allows you to understand which layer the error came from in your source data, and allows you to make different decisions based on the type of feature you’re correcting.
The Analysis types field is a concatenated list of all the asset types that are located in the area of the network where the error was discovered, including the error features themselves. This information gives you context surrounding the error, which allows you to make an informed decision on how to handle the problem.
Each error code corresponds to a different type of topology error that you must fix before you can start using your utility network for tracing and analysis. Even if your source data is from a geometric network, you will likely still have topology errors to resolve because the geometric network did not require you to fix these errors.
Below, you can find a summary of the different types of errors the tool can detect, what actions are available to fix each error, and whether each error will result in a topology error or is included for quality assurance/review purposes.
| Topology Error | Description | Actions Available | Impact |
| Ambiguous connectivity | This occurs when there is more than one rule available for a potential connection. | None | Topology error |
| Duplicate vertices | This occurs when a line has two or more duplicate vertices. | Delete (Vertex) | Topology error |
| Edge connectivity policy | This occurs when a line has a connection that violates its edge-connectivity policy. | None | Topology error |
| Invalid terminal | This occurs when the from terminal id field or to terminal id field of a line is not valid for one of the devices/junctions it’s connected to. | None | Topology error |
| Midspan terminal device | This occurs when a device that has a terminal configuration is drawn midspan on a line. | None | Topology error |
| Missing junction | This occurs when two features with a different asset type are connected without a junction or device. | Create | (mid-mid) Review for correctness.
(all others) Topology error |
| Rule missing | This occurs when two features could be connected but there is not a rule that permits it. | None | Topology error |
| Self-intersecting line | This occurs when the geometry of a line intersects itself. | Delete (Vertex) | Topology error |
| Shape length | This error occurs when a line feature has a zero or near-zero length. | Delete | Topology error |
| Stacked points | This occurs when two or more junctions or devices occupy the same x/y/z location. | Delete
Update |
Topology error |
| Subnetwork tap | This error occurs when a feature with the subnetwork tap category is drawn at the endpoint of two lines. | None | Topology error |
| Vertex within tolerance | This error occurs when two vertices are within the spatial tolerance of the dataset but not topologically coincident. | Anchor
Snap |
Features may become disconnected |
If you select the option to provide a default resolution for errors, you will find the actions for the following errors prepopulated:
- Empty geometry – delete
- Shape length – delete
- Self-intersecting line – delete all but first
- Duplicate vertices – delete all but first
- Stacked points – delete all but first
Apply Resolutions
Manually cleaning up data is something that many customers do in preparation for their data migration. However, certain errors lend themselves well to automated cleanup, or you may decide that for your first attempt at migrating to the utility network you want to quickly apply automated fixes to your data. This is done by populating the Error Resolutions layer from the analysis database, a process we cover in greater detail in the Resolving topology errors article.
Once you’ve provided resolutions for all the errors you feel comfortable automating, you can run the Apply Error Resolution tool to apply those resolutions to your database. These tools are designed to be run on a local geodatabase (file geodatabase or mobile geodatabase), but they can also be run against an enterprise geodatabase, as long as it isn’t registered as versioned. The topology for the utility network must be disabled for the tool to apply edits. Because you cannot undo the edits, you should consider making a copy of the geodatabase before running the tool in case you are not happy with the resolutions you selected.

Once you have applied the resolutions for all your errors, you’re ready to enable the network topology. You can review a log of all the edits made by this tool by browsing the folder created in the output location. This folder will include logs for each table describing which features were updated and information about any errors that couldn’t be corrected.
Additional Resources
Enable the Topology
When you enable the network topology, you’re telling the utility network you’re ready to begin editing and tracing the data. This will cause the system to build a topology for all your data and report any errors it finds. Each of these errors is represented as a Dirty Area in the network and is encoded with information that describes the error. Customers who used the Migration toolset to migrate and resolve errors in their data should find very few, if any, topology errors. This is because the Analyze Network Data and Apply Error Resolutions were specially designed to find and fix the most common types of topology errors in utility networks configured by the Migrate to Utility Network tools.

Once you’ve done this, you can see how many errors remain. If there are remaining errors, you can either repeat the automated resolution process by creating another error resolution database, or you can resolve the remaining errors manually.
Additional Resources
Editing and Connectivity with ArcGIS Utility Network
Conclusion
Once you’ve resolved most, if not all, of your topology errors you can start using your data locally to perform tracing and analysis. It’s recommended that you take some time to familiarize yourself with the tools and try out some of your more common workflows. Even though this utility network behaves a lot like your previous dataset, you’re likely to find yourself wanting to make some adjustments to the model.
As you work through this process you will want to keep the following resources close:
- You can find a full list of all the possible network errors on the Errors page in the online help.
- Read the Feature restrictions and rules page to learn the difference between a network rule and a feature restriction, along with the constraints for what types of features can be connected or associated.
- Read the Dirty area management with the utility network article to learn how the utility network uses dirty areas to track and validate edits made to the network topology.
If you want industry specific examples of how to resolve errors, check out the related articles below. You can also find detailed examples of the actions available for each resolution in the Resolving topology errors article.
If you haven’t already, you should go to the Get Started with the Migration Toolset article on the Esri Community Site and read the document on resolving topology errors. While you’re there you can also find additional resources that describe how to configure your own industry-specific model. The Esri Community site is also a good place to ask questions, download these tools, and find additional resources covering topics like configuration and data migration.


Commenting is no longer enabled for this article