By Aileen Buckley, Mapping Center Lead
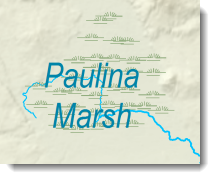
Another way to create polygon symbols that appear more realistic is to use marker fill symbols that mimic what you would see on the ground, but also to vary them so that they do not clip at the polygon edges (figures 1 and 2).
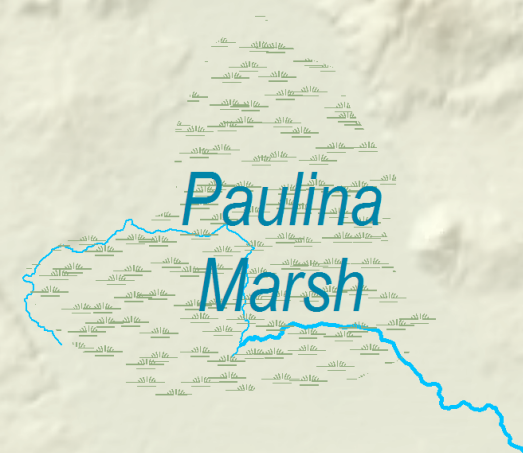
Figure 1. A marsh symbol created as a marker fill symbol that clips at the edge of the polygon appears abrupt and unrealistic
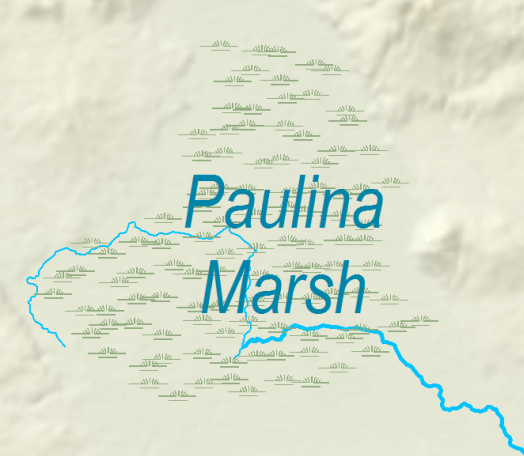
Figure 2. Using cartographic representations, the symbol can be modified so that the marker symbols are not clipped, thus appearing more realistic
The approach we took to create the symbol for the swamp/marsh features on the Crater Lake area map used the following steps.
- In ArcMap, right-click the polygon layer and click Properties.
- On the Symbology tab, use the Features renderer (assuming this layer only contains marsh/swamp features).
- Double-click the symbol patch and click Edit Symbol.
- Change the Type to Marker Fill Symbol and click the Marker button.
- In the Symbol Selector dialog box, search for a marsh symbol. Scroll to the bottom to see the “Marsh, saltmarsh, or reeds” symbol in the Ordnance Survey style (figure 3).
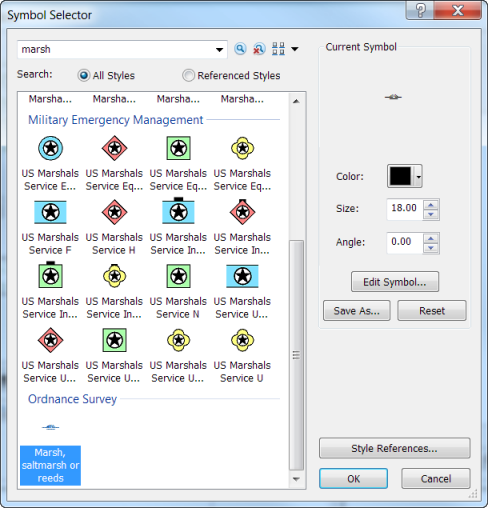
Figure 3. The marsh symbol in the Ordnance Survey style
- Select it and change the size to something that looks realistic for your map, for example, we used 4 points.
- Click OK.
- Change the color (we used HSV 95 27 68).
- Click the Outline button and change the color to No Color. Click OK.
- Select the Random option for the placement of the markers within the fill symbol (figure 4).
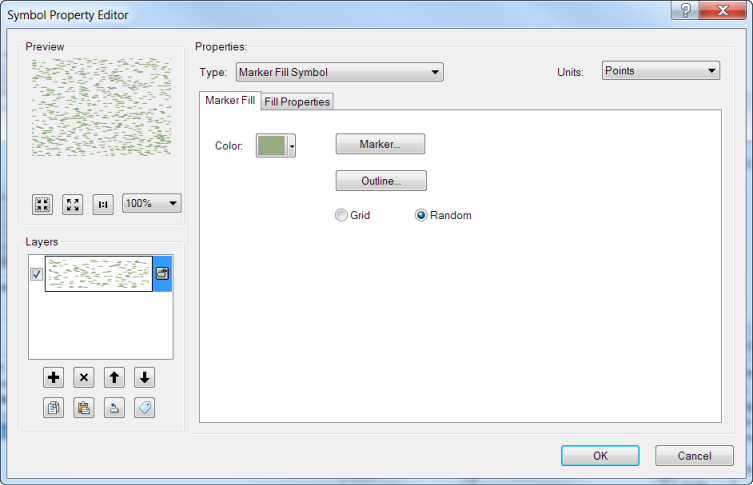
Figure 4. The Symbol Property Editor dialog box for the marsh marker fill symbol
- On the Fill Properties tab, experiment with the Separation X and Y values to find something that looks realistic on your map—generally, I find that I need to drop these values a bit (figure 5).
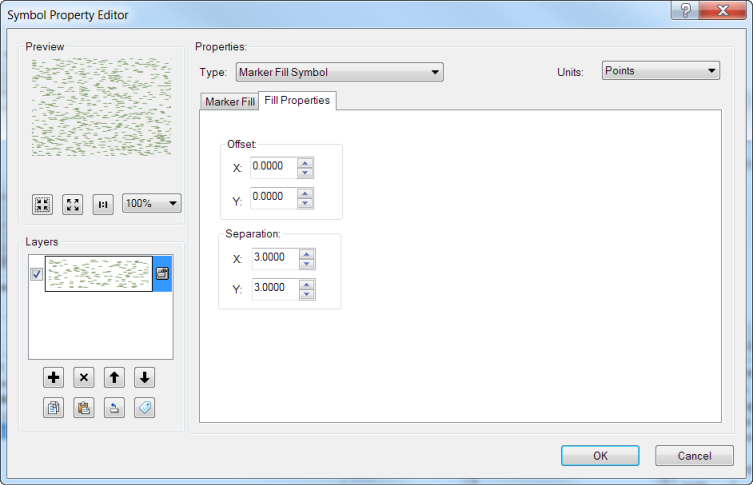
Figure 5. The Fill Properties tab of the Symbol Property Editor dialog box for the marsh marker fill symbol
- Click OK to keep all your changes.
- Make sure the polygon data you are symbolizing is in a geodatabase so that you can convert to representations.
- Right-click the layer in the table of contents and click Convert Symbology to Representations.
- Right-click the layer in the table of contents and click Properties.
- On the Symbology tab, click the Marker layer. You may have to reset the marker size. For Clipping options, choose either Whole markers cross boundary or No markers touch boundary (figure 6).
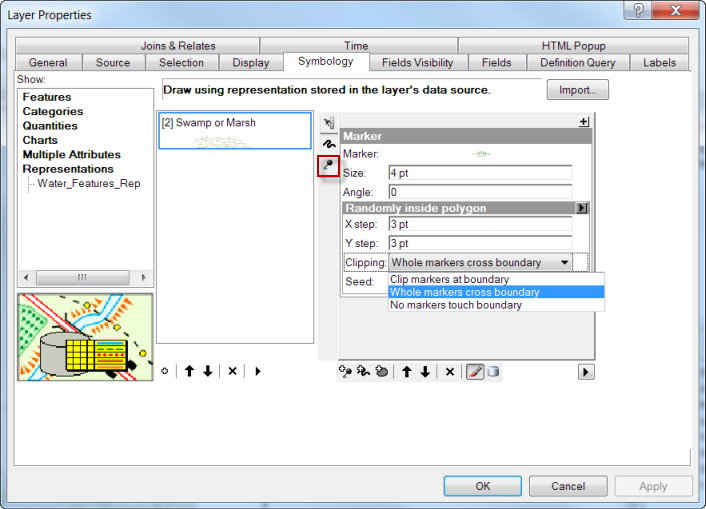
Figure 6. The settings for the marker layer of the cartographic representations for the marsh symbol
- Click OK to keep all your changes.
Although the difference is subtle, a map reader with an experienced or inquisitive eye will notice your high-quality symbology.
Thanks to David Barnes, Cartographic Product Engineer, for his Crater Lake area map.

Article Discussion: