The esri High Water Map is a public information viewer that reports current water levels and flood forecasts for more than 4000 gauges on streams and rivers across the United States.
With only a few seconds’ look at the high water map, you can see what parts of the USA are experiencing flooding right now. In addition, you can see places that are forecast in the short term to undergo catastrophic flooding. Gauges forecast to go
into major flood stage appear as subtle but attention-demanding
animations on the map.
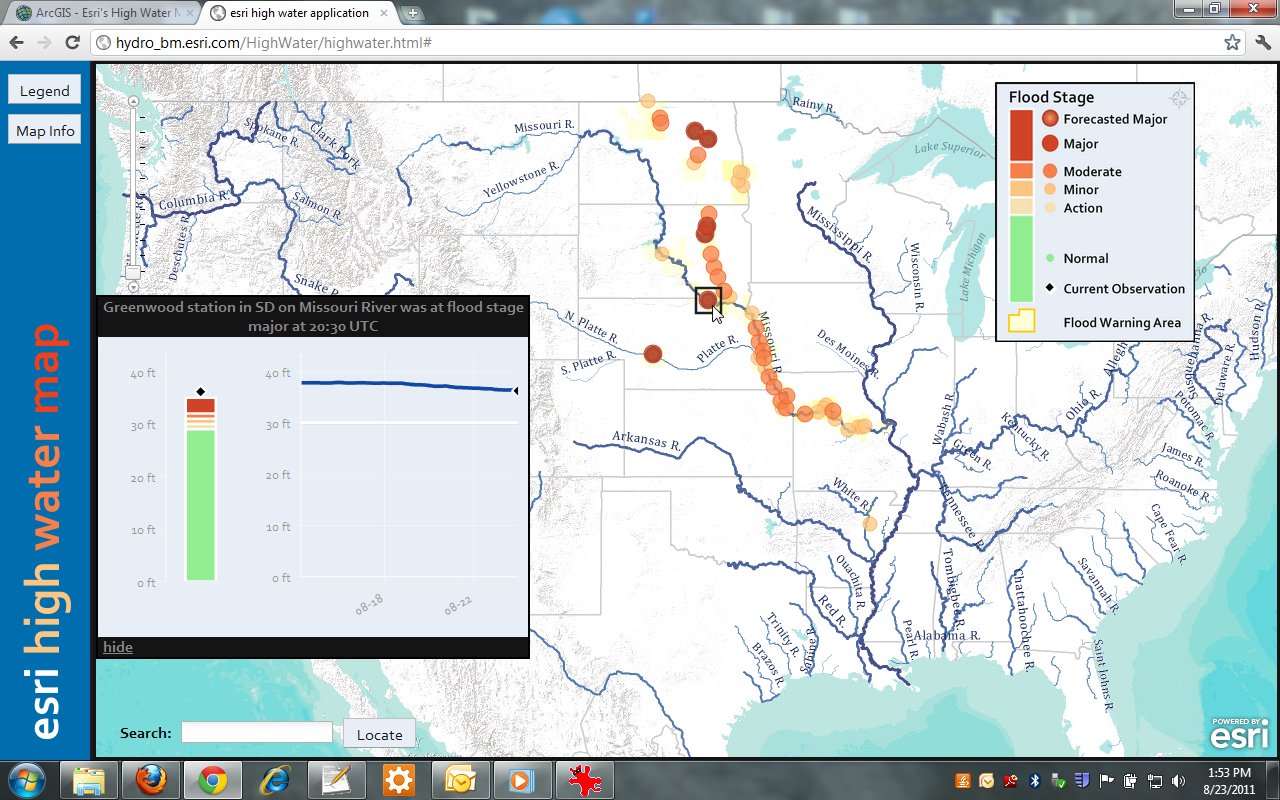
Screenshot of the esri High Water Map
Click on any gauge to find out the current water level expressed by the gauge, plus an archived water level for the past week, and the forecasted water level for the next several days from the National Weather Service. Clicking on a gauge makes these facts appear in a graph that on the left side of the map.
The High Water Map is a multiscale experience, so zooming in allows the map reader to see all available gauges, including the ones that pose no current danger to life or property. Gauges in normal condition are left off the smallest scale maps, because this is not a map of gauges per se. This map is about high water. The subject of the map is current flooding and uses gauges to tell the story.
If you would like a brief guided tour that will get you started
using this map, Caitlin Scopel of the esri Mapping Center Team prepared
this five minute introductory video which will show you how to get started using the High Water Map and how to get the most out of this resource.
In case you are wondering where the gauge went that you know exists but isn’t on our map, you should know that our viewer is set up at this time to only parse xml feeds from the National Weather Service and NOAA. This is largely because it is the most well-represented gauge network in the United States. It is the one with the best coverage nationwide, but it is by no means the only system of gauges in the United States or the world. In the United States and many countries around the world, there is no single common live gauge reporting system. So to demonstrate the map we chose a reliable, authoritative gauge system which covers most of the major river systems in the United States.
The High Water Map has the potential, however, to be adapted to read gauges from other agencies around the world with a few adaptations.
At this point in time there is promise there will be in the future a common worldwide system of gauge reporting. A standard based upon WaterML holds promise for the creation of a global, live gauge data stream using a common publishing format. Once this standard is agreed upon and implemented, the public stands to greatly benefit. With a common standard and structure, all mapping technologies may combine, read and show live services. A common standard and structure lets every gauge be in every map now, in everything from simple products to sophisticated forecasting and analysis.
Special thanks to Michael Dangermond for providing this post. Questions for Michael: mdangermond@esri.com

Article Discussion: