We’ve added functionality that has been requested when styling features that can help organizing the values you see displayed in your legend and have the way they have been ordered in the Types style be respected in the draw order in the map.
- Grouping Values: Under the Types style you can now move values into groups which can add another level of organization that is displayed in the legend. This also helps reorder values by moving the entire group.
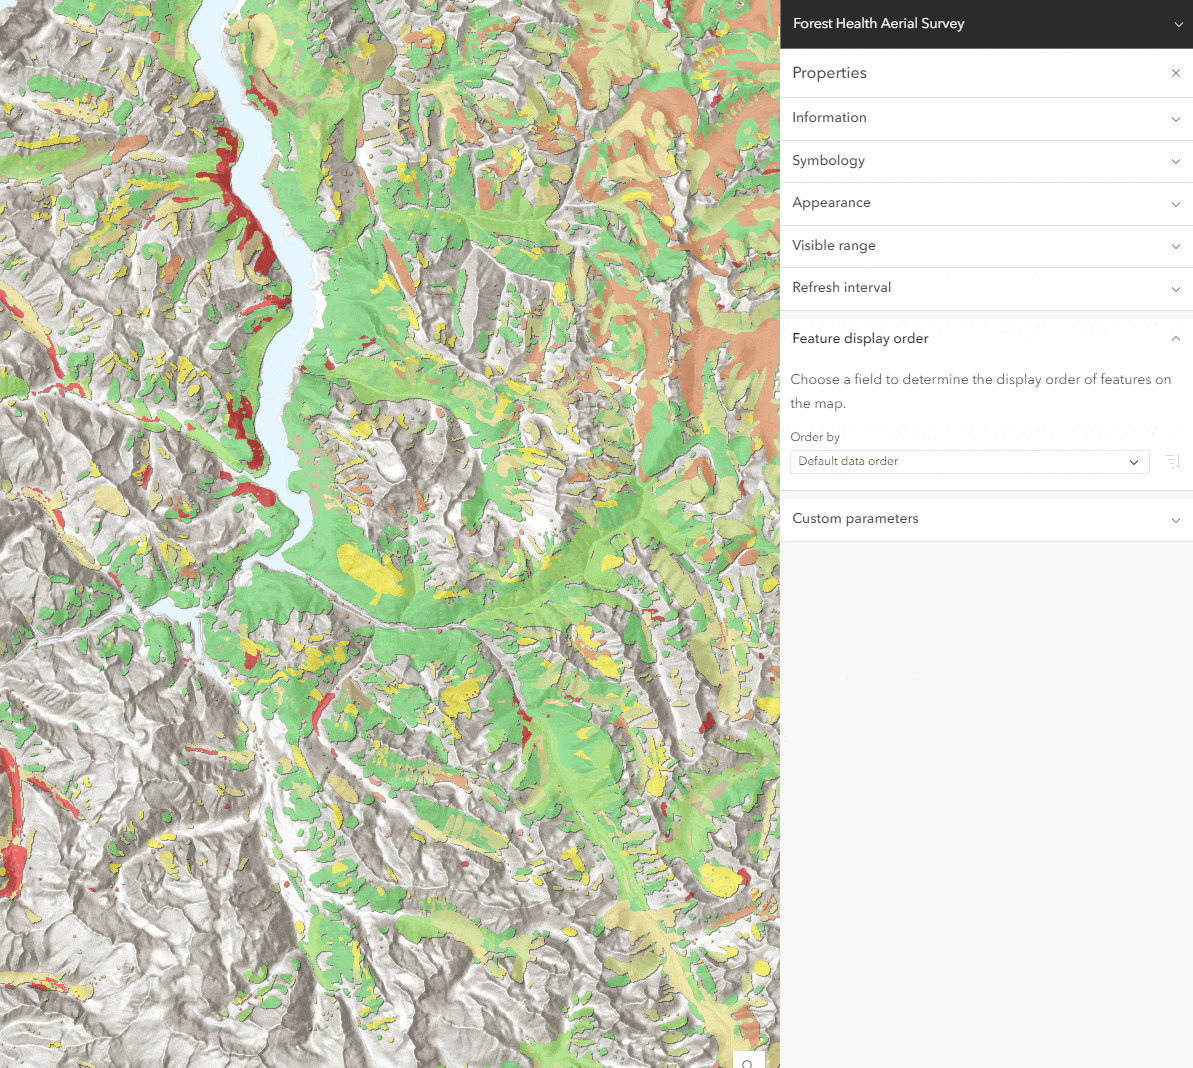
- Style display order: Previously you could only set a feature display order on a layer by a numeric or date field under the layer properties. You can now control the feature ordering in the map when using the order of values in the styles Types and Predominance. This helps you set the drawing order of features based on the order you set on the values in your style. This will help make the most important feature values easily seen in the layer and match the ordering seen in the legend which will further helping your viewers of the map and layer.
Getting started
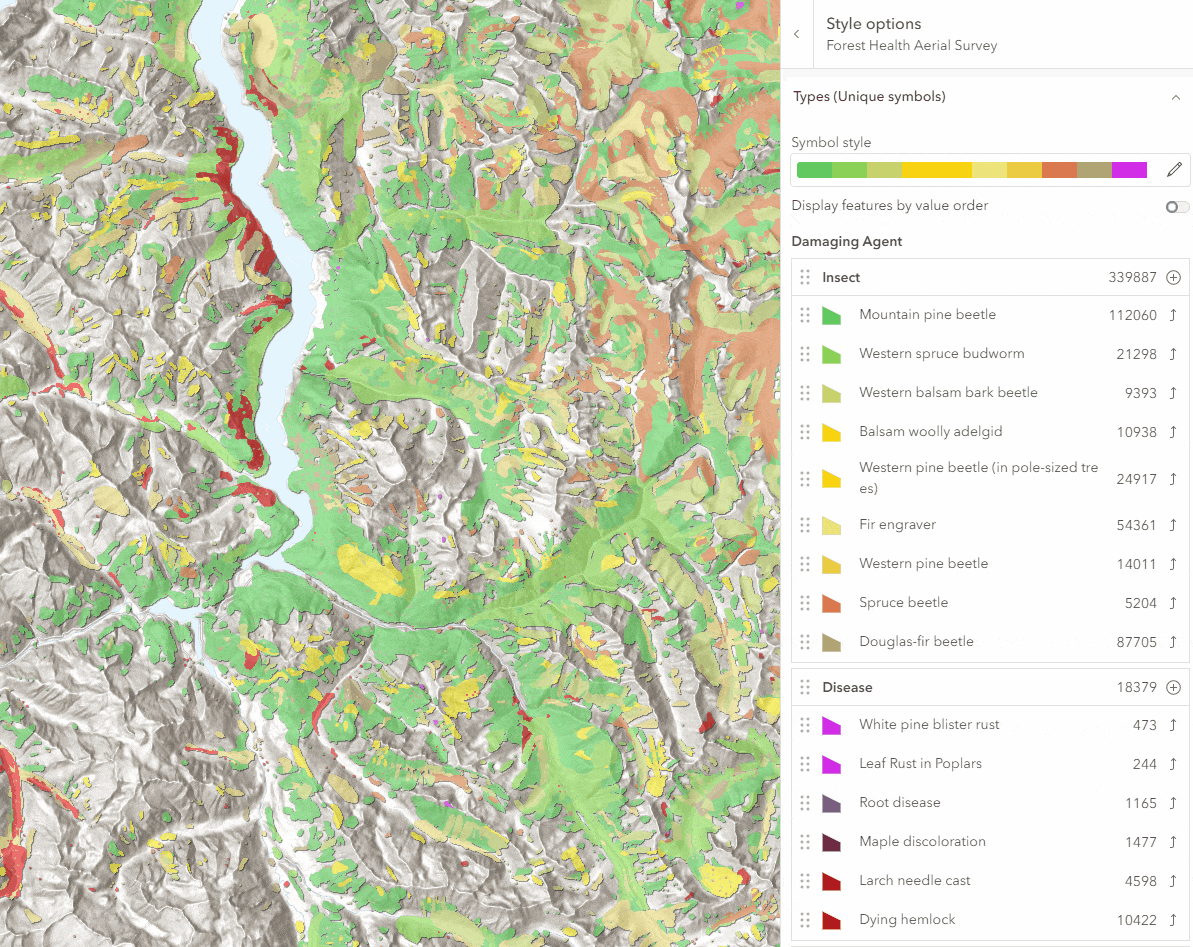
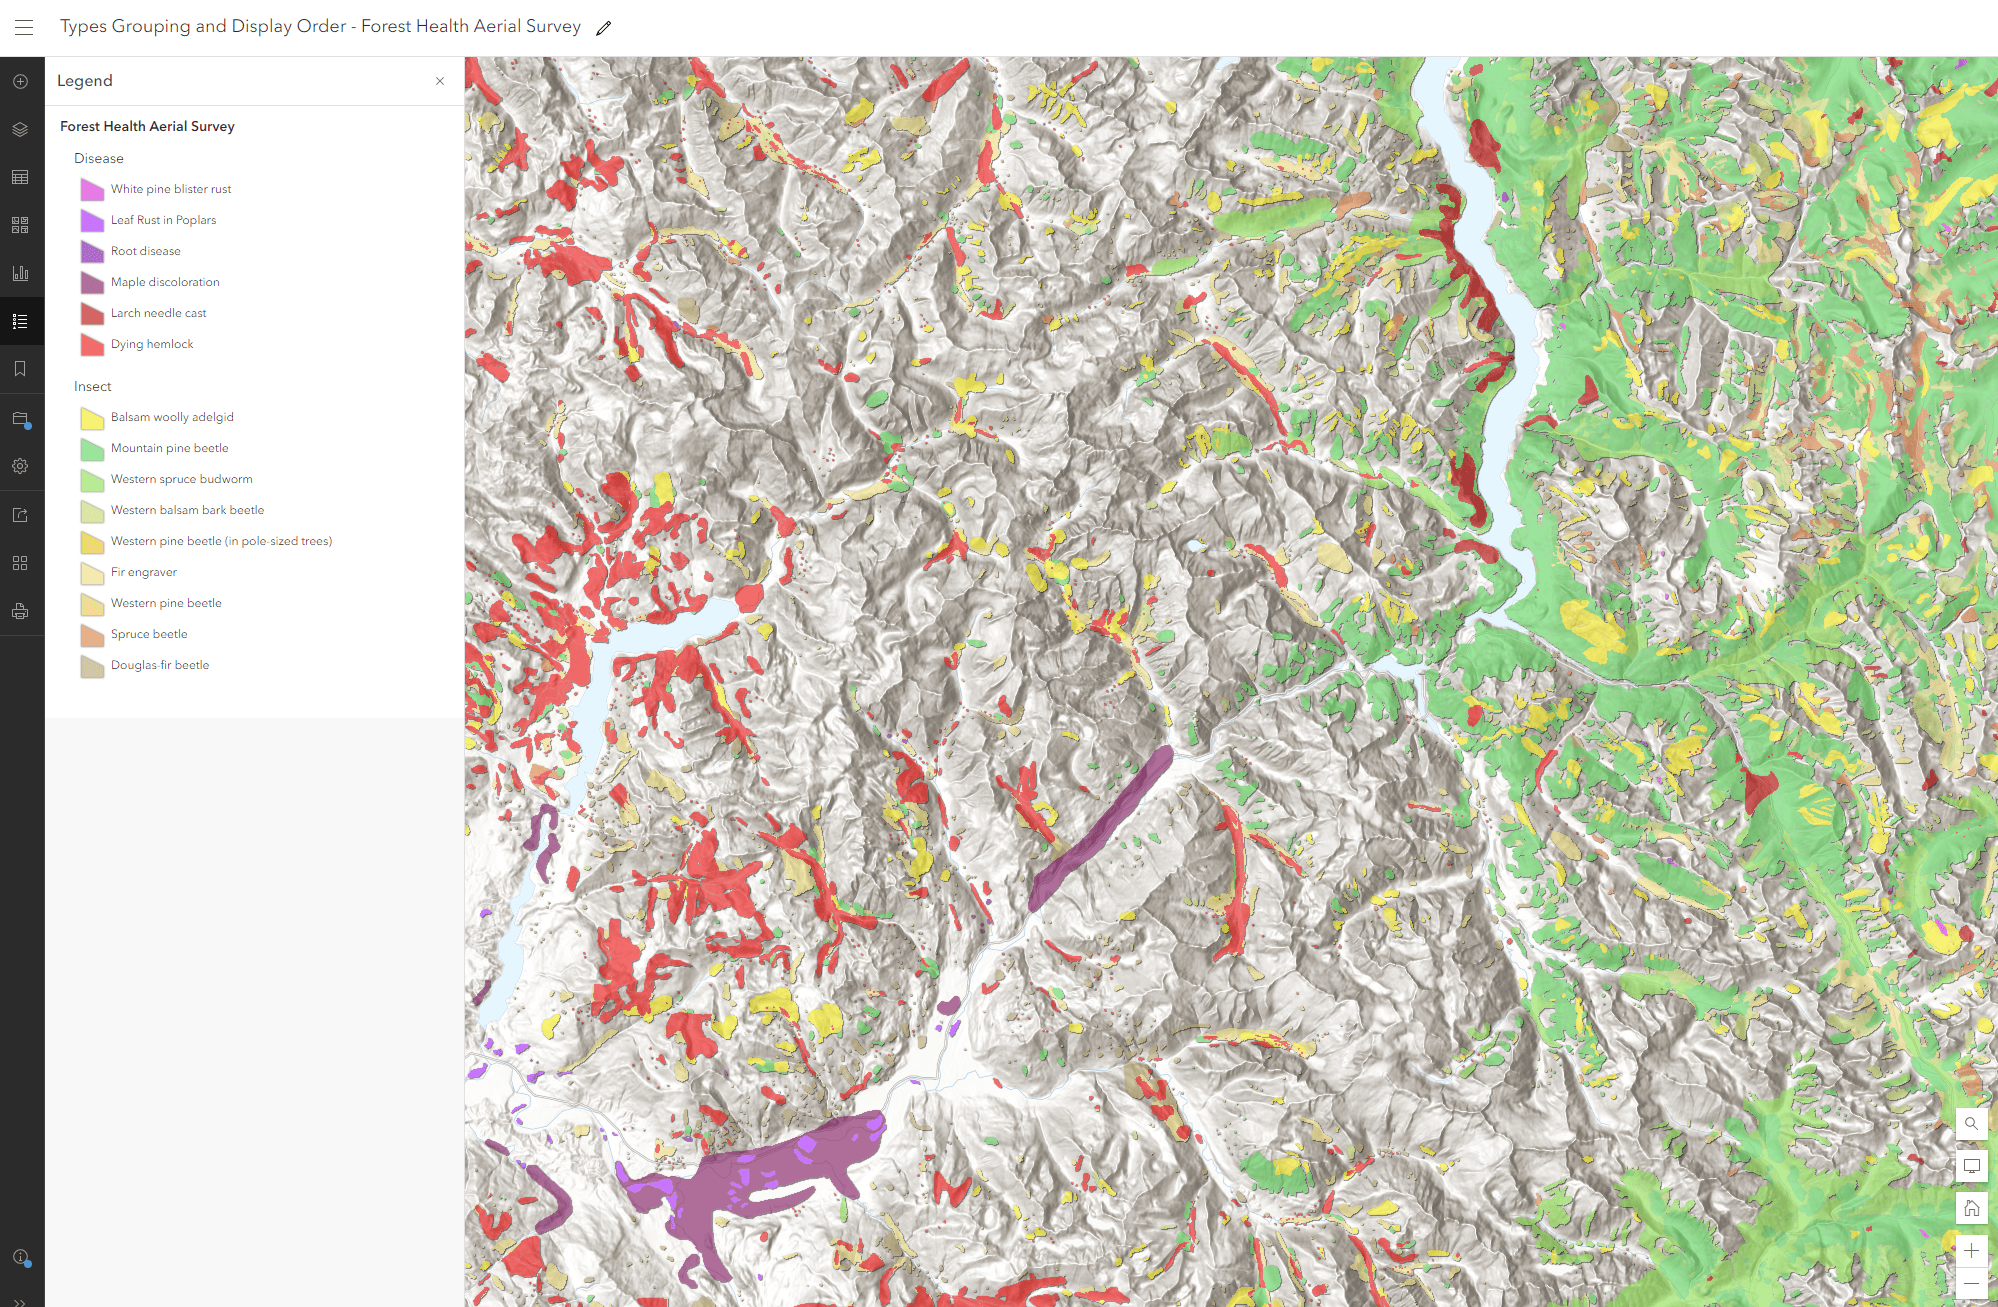
Here in this example is a Washington Forest Health Survey that is composed of polygon features that overlap with one another. This layer is using the Types style to uniquely render the different types of forest damage. The damage type reported can be categorized into two groups: insect and disease. The new grouping functionality will organize the values and help with viewers reading the legend.
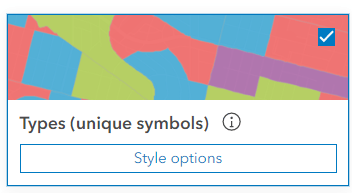
First go to the Styles panel and click on Style Option for the Types style
Next on the smart mapping you will see a few new things. When you open up the Types style options you will see your values in a default grouping of values. The group does not require a title and by default it is empty but if you enter in a title it will be reflected in the legend for the layer. For this layer on forest damage I want to classify the data into two groups. This first group I am going to change the title to Insect to capture one of the forms of damage to forest.
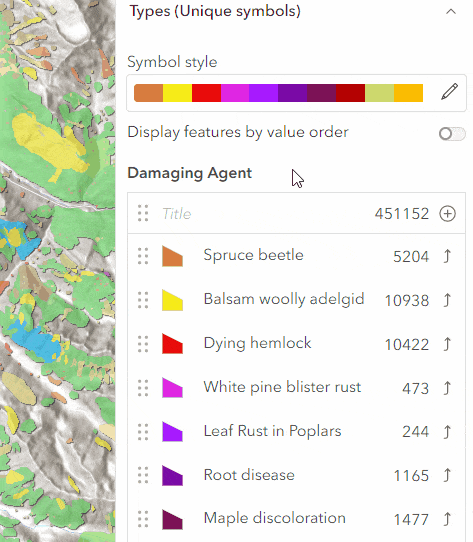
Next I am going to create a new group called Disease. To create a new group simply click on the up arrow to move the value to a new group and then drag any other values you want into the new group.
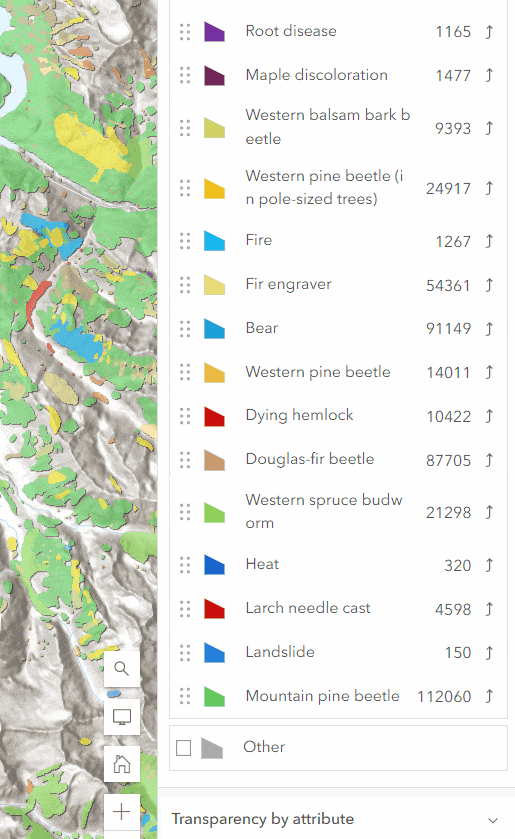
Now that I have my values broken out into 2 groups I want to work on the display order. I can do this 2 ways.
- On the style options panel enable “Display features by value order” and as you reorder values the map will be updated.
2. On the layer properties panel under Feature Display order you can switch from the default order, numeric or date fields to Style order which will appear when using Types or Predominance styles.
Now we have a map that has been updated to use these new features to help make features more prominent in the map with the new ordering ability and the legend reflects both the layer value ordering and the grouping of values. Check out these new features and help bring order to your maps!

Thank you for all these improvements. The Theme Builder seems to have disappeared with this new version. Or maybe it can be found somewhere else? Documentation for theme development (https://developers.arcgis.com/experience-builder/guide/theme-development/) still indicates that it can be found at https://experience.arcgis.com/theme-builder/page/default/?views=variables, but that results in a page that simply states Not Found.
Hi, Dave This is Yiwei from the Experience Builder. The theme builder has been removed in favor of the Storybook environment that will be available with the developer version 1.1 later this month. The reasons for doing so are: 1. the current theme builder serves merely as a UI reference for developers and can be replaced by the more powerful Storybook, and 2. Internally, we need to re-evaluate the theme builder itself Sorry for the inconsistency between the latest online build of ExB versus the developer doc. The doc will be updated along with new docs on how to use… Read more »
Thanks, Yiwei! I look forward to hearing more about Storybook.
What is the version number of this update? When will the developer edition of this version be available for download? Will we be able to migrate our previous work with the developer edition to the new version (and if so, will there be any breaking changes)?
Hi Dave,
Dev edition 1.1, planned on 7/23, will pick up new features from this online edition update. You should be able to migrate apps built with the current 1.0 version to 1.1. An upgrade doc will be provided.
Thanks, Jianxia!
I am unclear regarding: “More data types are now supported, including a map service as a group layer.” I was able to add an ArcGIS Server Web Service group layer as a URL data source in ExBuilder. The same group layer could not be added into a web map using Map Viewer Classic. Is there any way to use group layers in the map widget (and the map layers widget so users can turn groups on and off)? I have heard Map Viewer Beta will support group layers (perhaps this summer), but I have not heard anything about using Map… Read more »
In the previous version, when you added a map service with sublayers, Experience Builder (ExB) added each sublayer in as individual layer in Data tab other than grouped sublayers under its parent as this version does. If you have a group layer in Map Viewer Beta and bring the map in ExB, the Map layers widge will display the group layer automatically because both Map Viewer Beta and ExB are built on JSAPI 4.
Is it recommended that we use Map Viewer Beta with production Experience Builder applications?
No, I would not recommend any beta software in the production.
Wow, that’s a lot of new stuff! Super happy to see the copy/paste for widgets.
Thank you for the added functionality to Experience Builder. I did notice that I see a message, ‘Upgraded from previous config’ listed under my data in the List widget. This only seems to appear for web experiences created before this latest update. Is this from the new Data View portion of the update? Is this expected?
Thank you
Jillian
Sorry for the delay. Yes, it is from the data view and is expected. Specifically, when the widget was configured with data that has any filters, sort fields, etc. in the previous version, the data source it connected to becomes (“is upgraded to”) a data view by default in the current version. We should have clarified it.