We’re excited to share the latest enhancements to ArcGIS for Microsoft 365, featuring key updates to ArcGIS for Excel, ArcGIS for Teams, and ArcGIS for SharePoint. These improvements make it easier to work with spatial data, streamline editing, and introduce smarter tools powered by AI.
Don’t have time to read the blog? Watch this video for a quick overview:
Quick Links
ArcGIS for Excel
ArcGIS for Excel introduces key features that streamline spatial data management within Excel. Users can now add and edit reference registered data (referenced feature layers. Support for JSON with Z and M values enhances data analysis by incorporating elevation and measurement data directly in Excel. The ability to draw polylines and polygons on the map, saving layer styling to ArcGIS ensures consistent map appearances, facilitating collaboration and maintaining a uniform look across different projects and platforms.
Support for adding and editing reference registered data
ArcGIS for Excel now allows you to add and edit reference registered data (referenced feature layers) directly within Excel by registering different types of data stores through ArcGIS Enterprise. You can make changes to your data in Excel, and these changes will automatically update the corresponding data in ArcGIS Enterprise and user-managed data stores, such as enterprise databases, folders, cloud stores, and NoSQL databases. This feature enables knowledge workers to collaborate on spatial data without leaving the familiar Excel environment. To learn more and watch a demo video please refer to Using ArcGIS for Excel to Edit Referenced Data blog.
New functions
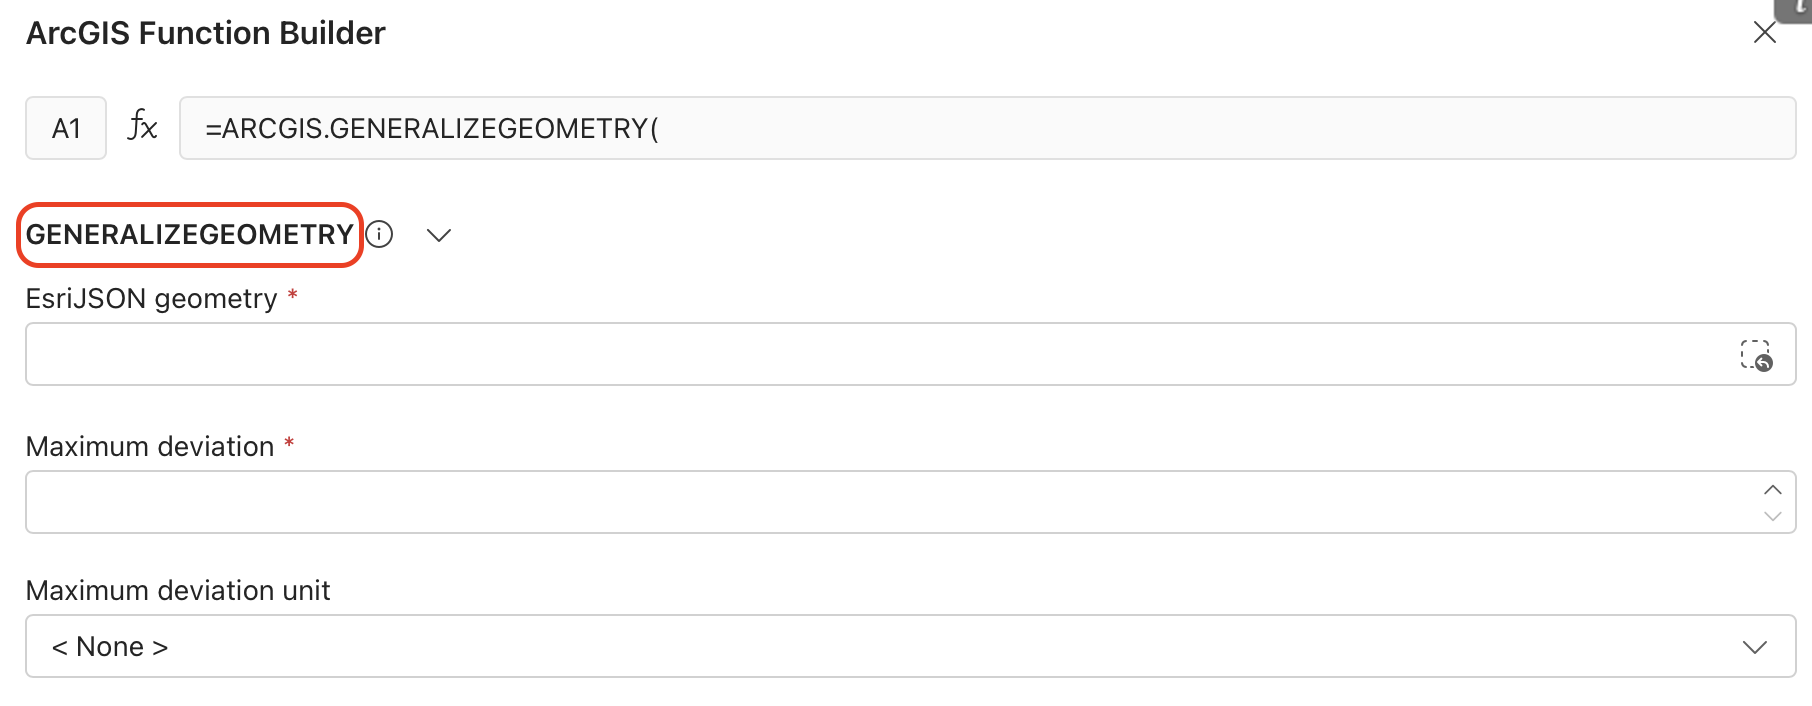
ArcGIS for Excel’s Function Builder has introduced several new functions that enhance the functionality for working with different geometries, such as points, lines, or polygons:
- Get centroid of a geometry: Easily retrieve the centroid of a geometry, helping you pinpoint the central location of their features, summarizing the location of a feature or area and making it easier to perform spatial queries and calculations.

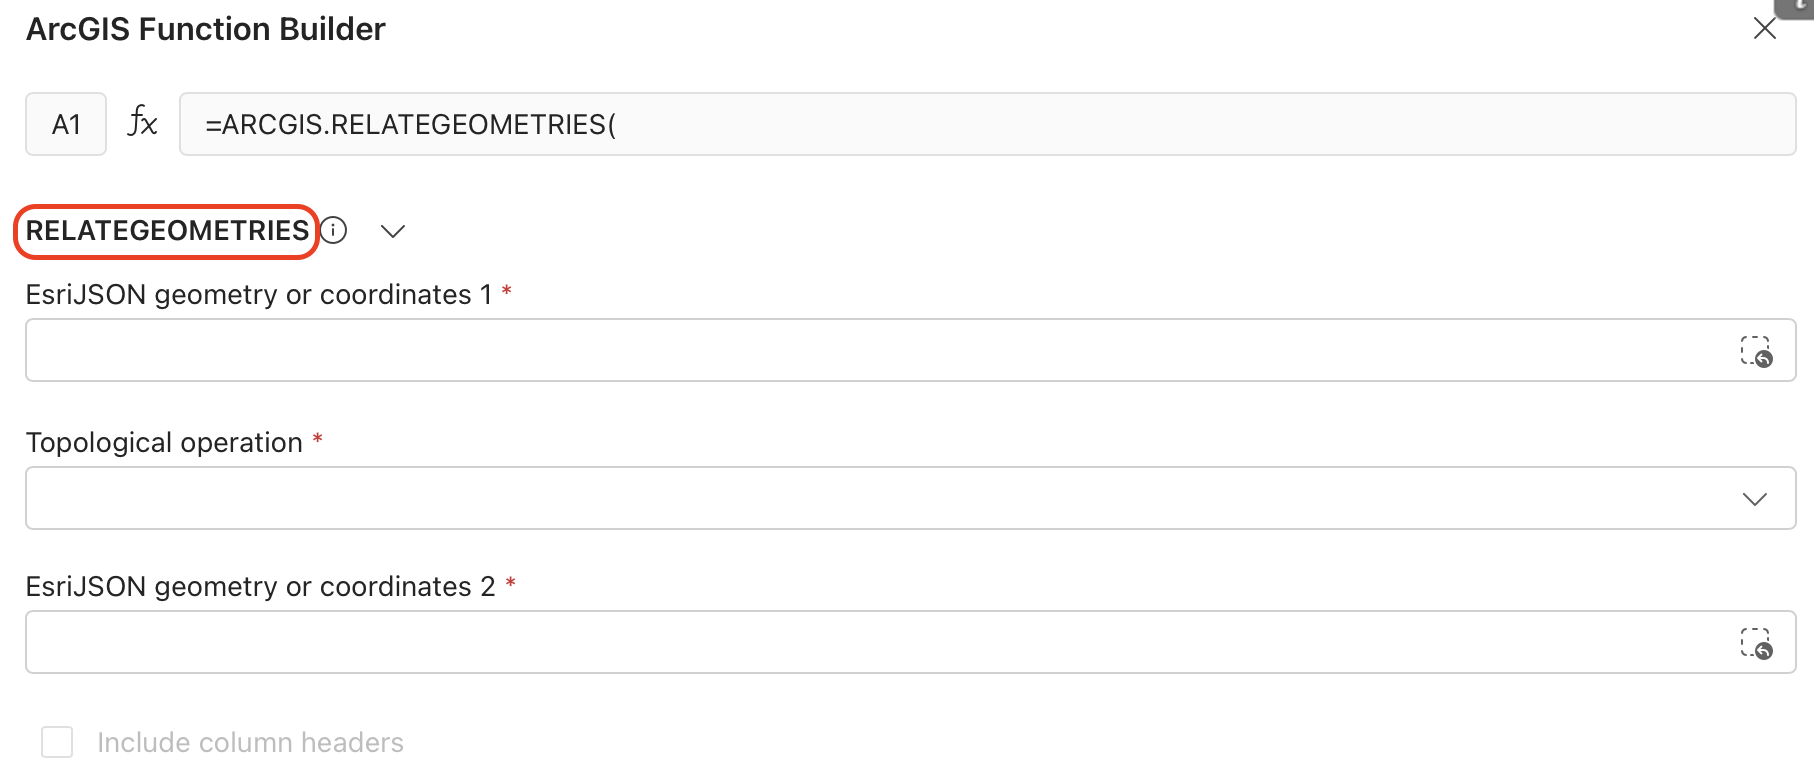
- Determine relationship between two geometries: Determine the spatial relationship between two geometries to enable a deeper understanding of the spatial interactions between features. You can identify whether the geometries intersect, contain, touch, or are disjointed. For instance, on a map showing store locations and delivery areas, you can use this function to see which stores are inside the delivery zone (can offer delivery), which are on the edge (might need special arrangements), and which are outside (can’t offer delivery). This helps in making informed decisions about service offerings and resource allocation.
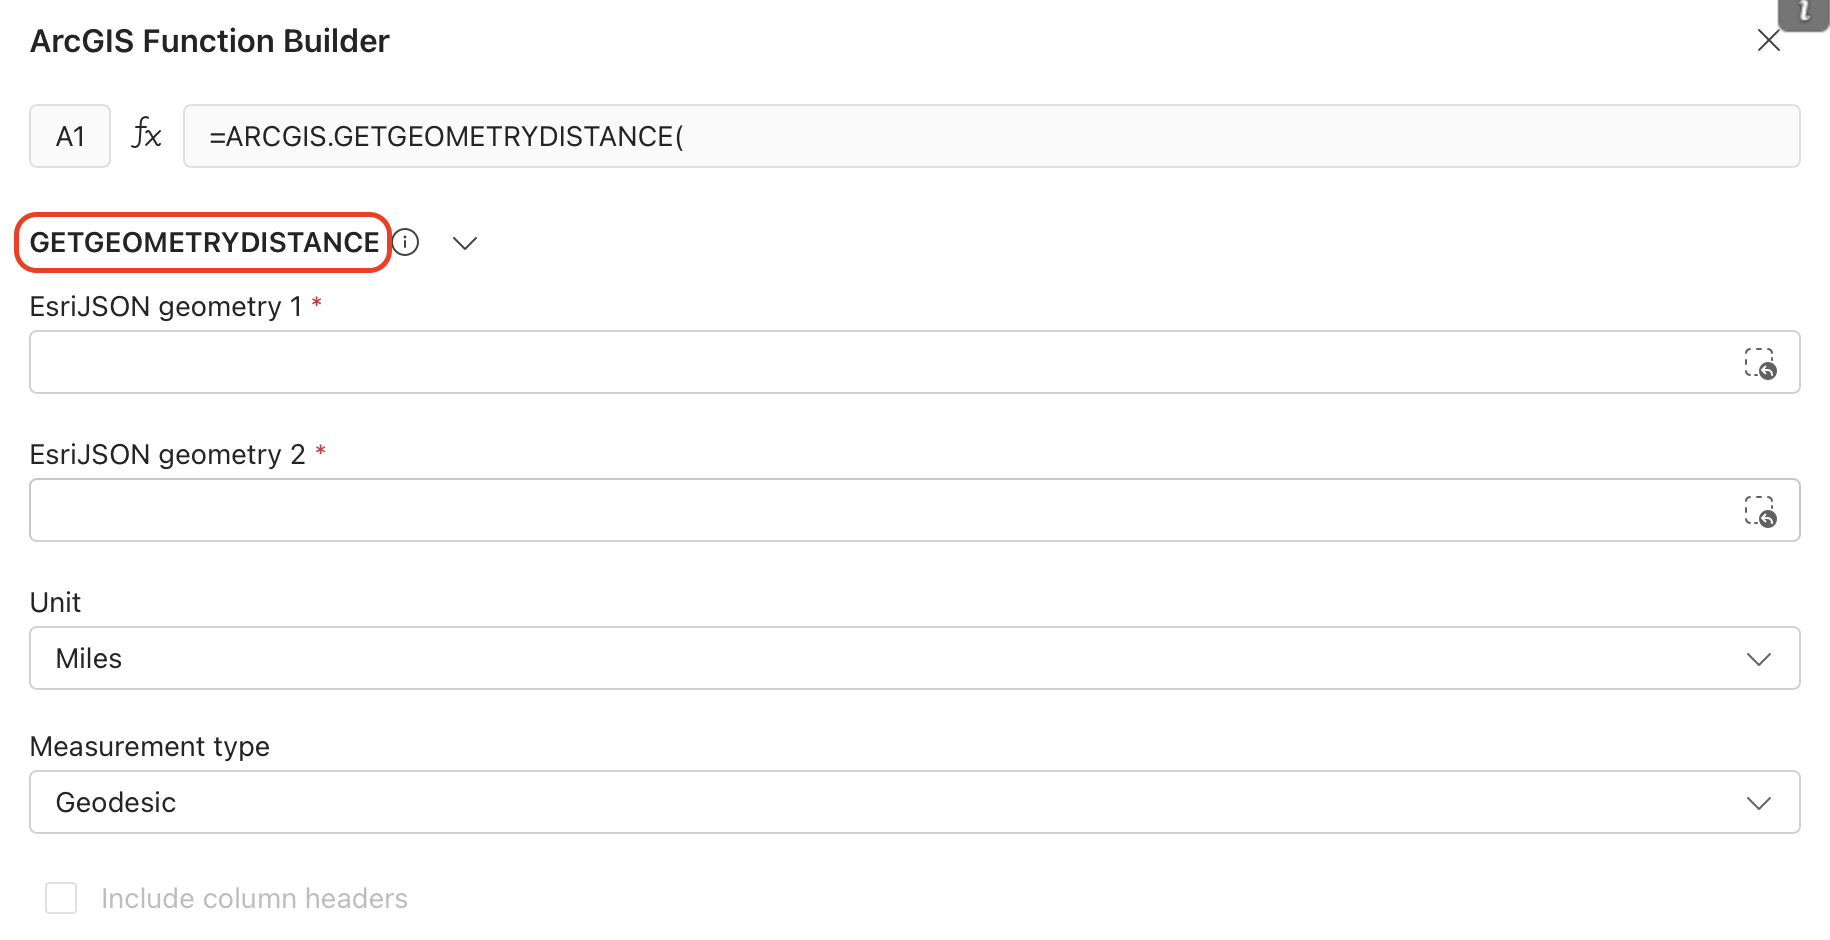
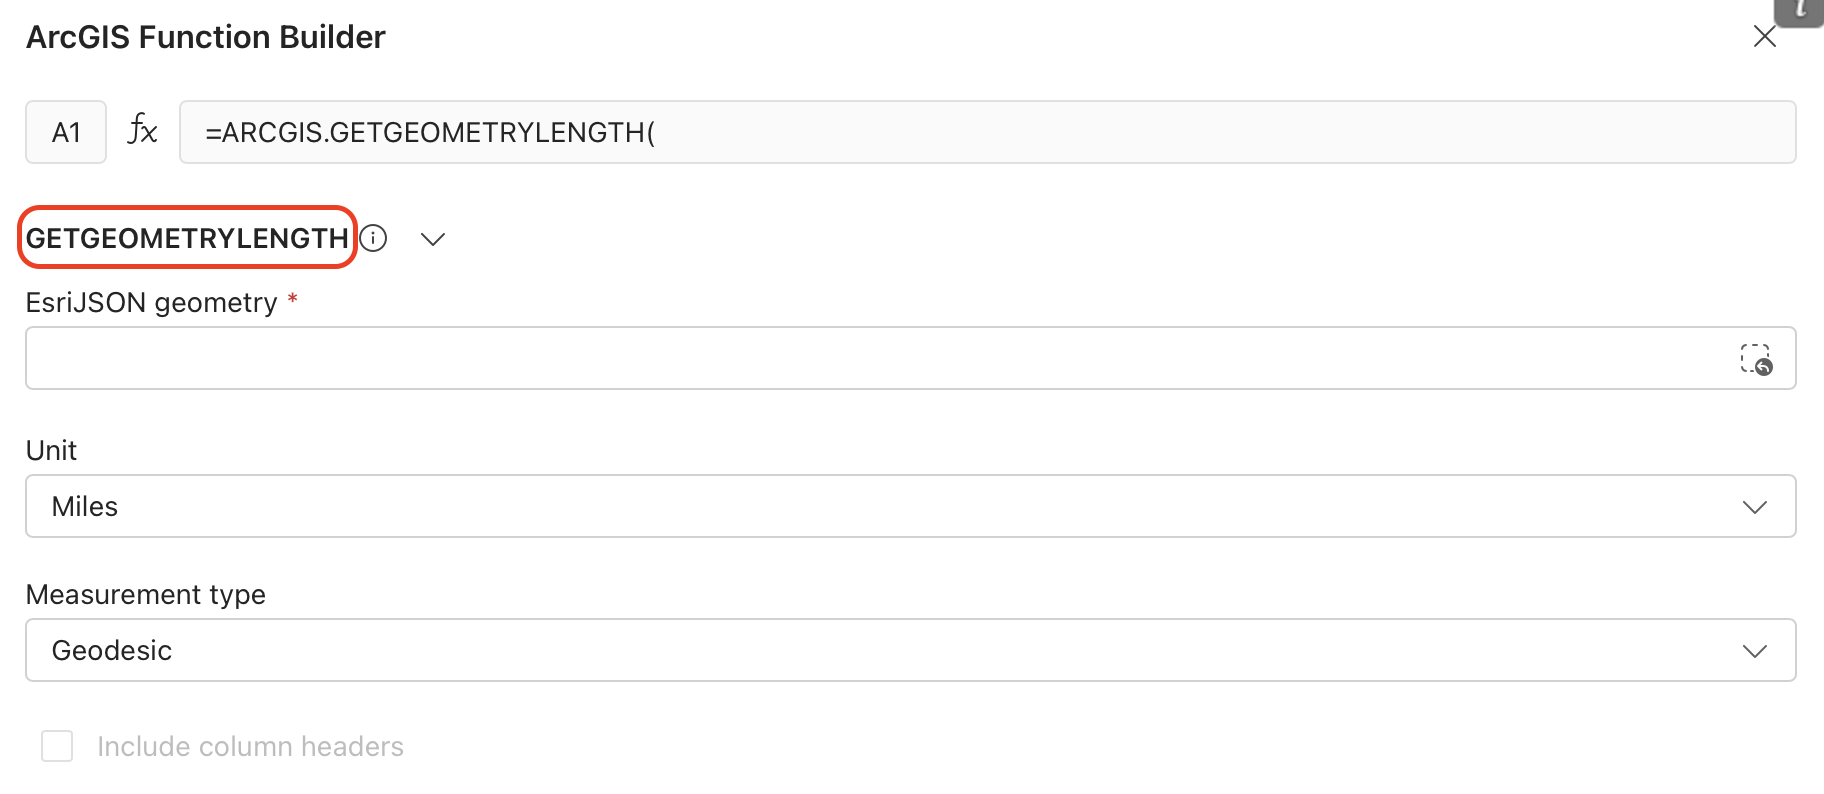
- Measure the distance or length between geometries: Calculate the distance between geometries and length or perimeter of a line feature or a polygon, facilitating precise spatial measurements. This function is invaluable for tasks such as route planning, network analysis, and other applications requiring accurate spatial measurements.
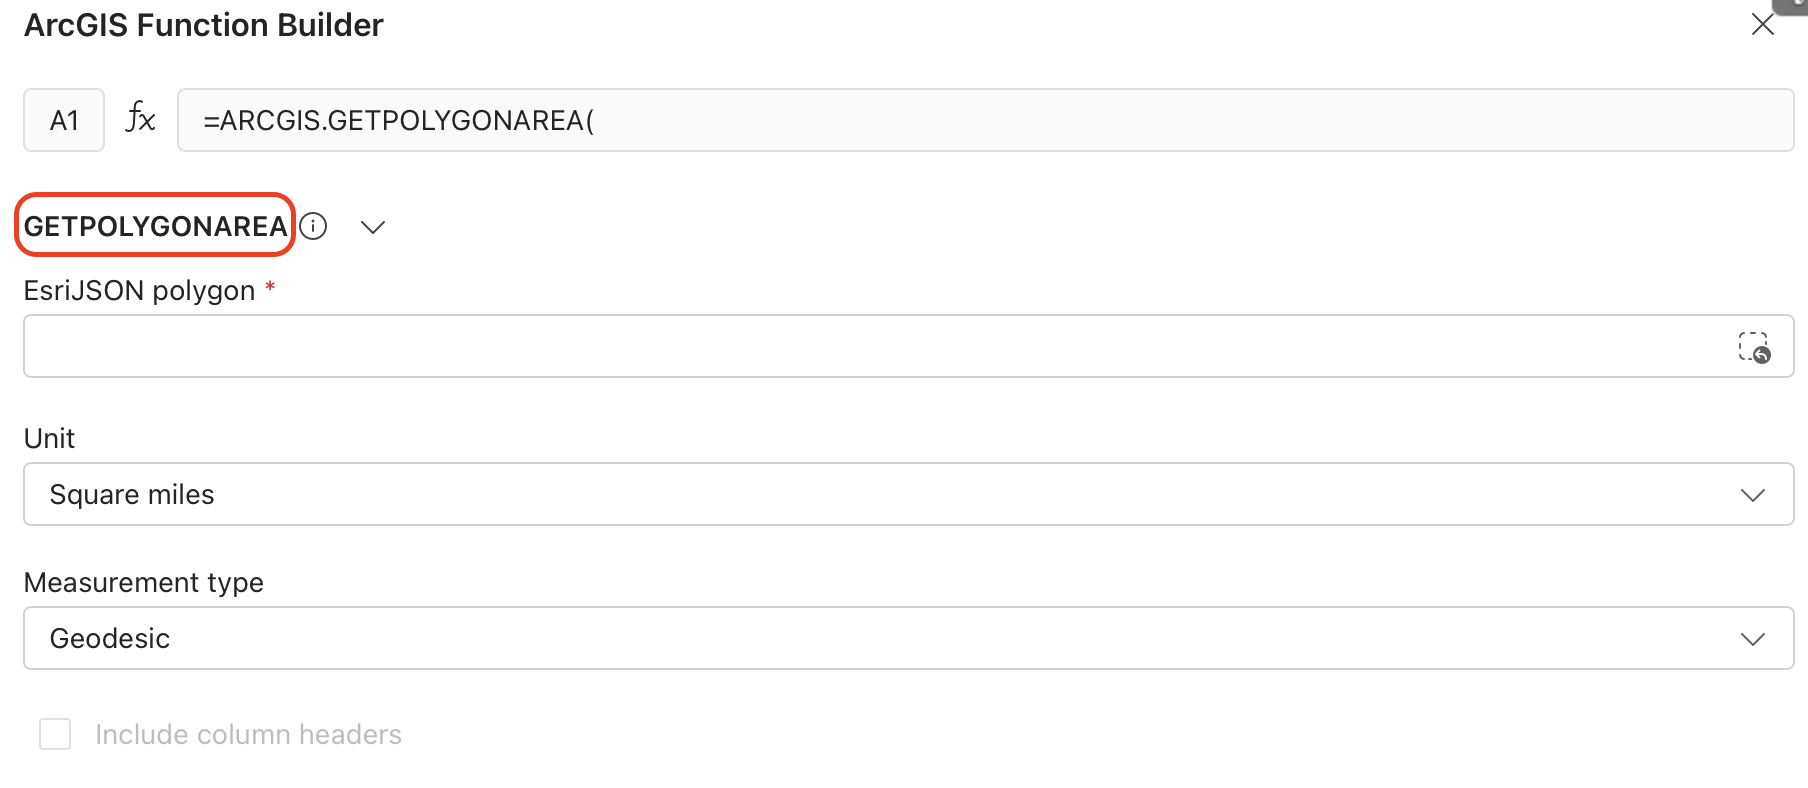
- Calculate area of a geometry: Compute the area of a geometry to support data-driven decisions for activities like zoning, resource allocation, and ecological assessments. This function is essential for tasks such as land management, environmental analysis, and urban planning, where accurate area measurements are critical.
- Simplify the shape of a geometry: Simplify the shape of line or polygon geometries by reducing the number of vertices while preserving the essential form of the feature. This function is particularly useful for optimizing complex datasets, improving map visualization, and enhancing performance by decreasing data complexity.
Enhanced Functionality
You can now draw and create polylines and polygons directly on the map in Excel. This enhancement provides you with more flexibility and control over their mapping projects, allowing for more detailed visualizations.
In urban planning, city officials and planners often need mapping tools to visualize and analyze various aspects of a city’s infrastructure, zoning, and development projects. With the ability to draw and create polylines and polygons and create a feature directly on the map in Excel, urban planners can plot infrastructure projects, zoning analysis, green space planning, and flood risk assessment.

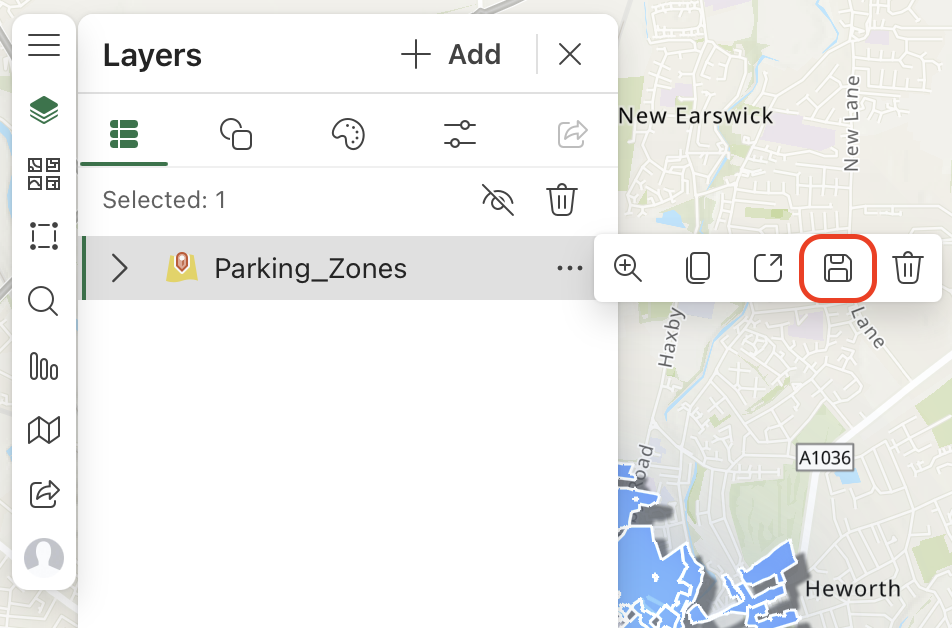
Now, users save the layer symbology, styling, and properties created in ArcGIS for Excel directly to ArcGIS Online or ArcGIS Enterprise. By saving their styling directly, you can ensure that maps and layers look the same across different platforms and projects, making it easier to collaborate and maintain a uniform look.
ArcGIS for Excel now supports JSON geometry that includes Z (elevation) and M (measure) values. This enhancement allows you to analyze and visualize elevation and measurement data directly within Microsoft Excel. By incorporating Z and M values into their JSON geometry, you can gain deeper insights into your data through precise visualization and analysis, improving terrain modeling, infrastructure planning, and environmental studies.
ArcGIS for Teams
ArcGIS for Teams introduces two key features to enhance user experience and functionality. The AI assistant, currently in beta, enables users to search for specific maps, layers, data, and other ArcGIS items using everyday language. New mapping tools have been introduced to enhance functionality within ArcGIS for Teams, allowing users to open ArcGIS layers in the viewer tab and configure their properties. These features collectively aim to streamline user interactions, improve search capabilities, and provide a more cohesive mapping experience within ArcGIS for Teams.
AI assistant in ArcGIS for Teams
The AI assistant in ArcGIS for Teams, which is in beta, enables users to find specific maps, layers, data, and other ArcGIS items using everyday language. This makes the search process more intuitive and user-friendly. The interactive conversation features provide step-by-step guidance and suggestions, helping you locate the right ArcGIS items, such as data and apps, more effectively. These enhancements improve the overall user experience, making ArcGIS for Teams more accessible and user-friendly, whether you are a new or experienced user.
Enhanced Functionality
We have introduced new mapping tools to enhance functionality within ArcGIS for Teams, allowing you to open ArcGIS layers in the viewer tab and configure their properties. This functionality provides a consistent and familiar mapping experience across different Microsoft integrations, ensuring a smooth transition between Microsoft apps.

ArcGIS for SharePoint
ArcGIS for SharePoint introduces key features to enhance spatial data management and editing capabilities within the SharePoint environment. The new Editor tool enables users to edit ArcGIS layers directly on the map, facilitating the creation, editing, and deletion of features with ease. Additionally, users can now customize layer styles and properties to ArcGIS, ensuring consistency across different platforms and projects.
New Editor tool in ArcGIS for SharePoint
The new Editor tool allows you to edit ArcGIS layers directly on the map, enabling them to create, edit, or delete features with ease, thereby enhancing the user experience in editing spatial data within the SharePoint environment.

For example, a utility company can use the ArcGIS for SharePoint to visualize and manage their data, locations and attributes of their power poles, transformers, and substations. They can use ArcGIS for SharePoint editor tool to efficiently manage and update the locations and details of assets like power poles and transformers. Field technicians and office staff can directly add, edit, or remove asset features on the map, ensuring accurate, up-to-date information for maintenance, compliance, and operational needs—all within their familiar SharePoint environment.
Save layer styling and properties
You now can configure the layer style and properties to suit their specific needs and preferences, and these modifications can be saved and applied in ArcGIS, ensuring consistency across different platforms and projects, which provides greater flexibility and control over the visual representation and characteristics of spatial data layers, improving collaboration and maintaining a uniform look.
Additional resources
The recent release updates are designed to make it easier to work with spatial data, streamline editing, and introduce the use of smarter tools powered by AI. We are committed to continuously improving our products to meet your needs and help you achieve your business goals.
To get the most out of these capabilities and stay updated, explore our additional resources, including the Esri Community pages for ArcGIS for Excel, ArcGIS for Teams, and ArcGIS for SharePoint, as well as the ArcGIS for Microsoft 365 product page.


Article Discussion: