The Spatial Analyst team at Esri is excited to announce the July 2025 release of Spatial Analyst Supplemental Tools version 2.0 for ArcGIS Pro. This toolbox boosts raster analysis productivity by demonstrating best practices for raster analysis workflows and sharing custom geoprocessing tools. The supplemental tools provide new functionalities not found in the ArcGIS Pro Spatial Analyst toolbox, to enhance analysis, visualization, and modeling capabilities. Similar to earlier releases, the tools can be used directly or customized to support your unique workflows.
What’s new in version 2.0
This release of the toolbox, developed for ArcGIS Pro, builds on the original supplemental toolbox with several new and enhanced tools for raster analysis and visualization.
New tools
- Create Flood Simulation Raster
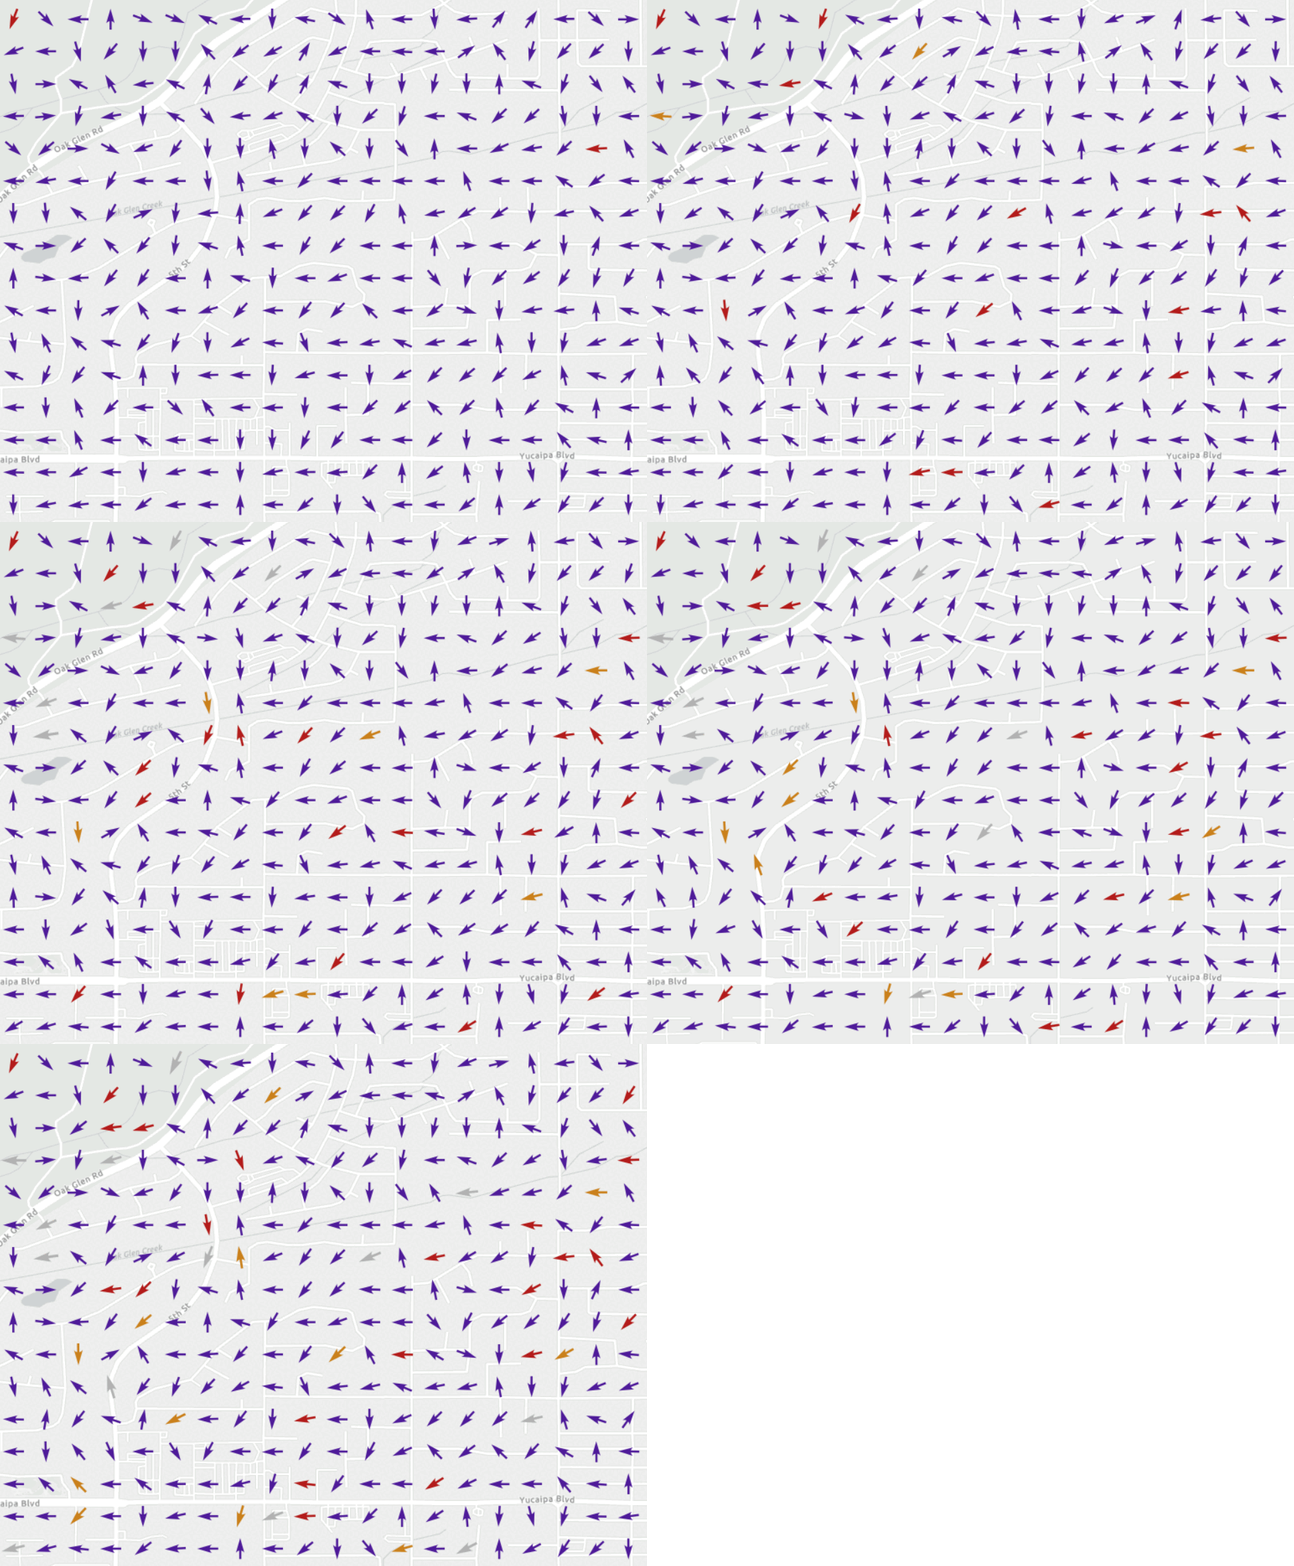
This tool creates a multidimensional raster dataset from flood simulation outputs (flood depth, water surface elevation, and water velocity), generated using flood simulation in ArcGIS Pro. It also builds a time-enabled mosaic dataset. The resulting multidimensional datasets support spatial and temporal visualization and analysis of flood dynamics. The water velocity output displays the U and V components using vector field symbology, and can be used with the Map Viewer Flow Renderer. Since the outputs are multidimensional, you can use the time slider to animate the flood variables through time.

- Locate Zonal Statistics
If you are interested in identifying where the cells corresponding to a calculated zonal statistic value (particularly minimum and maximum) are located within each zone, you can use the Locate Zonal Statistics tool. It first implements the widely used Zonal Statistics tool to calculate the specified statistic for the value raster within defined zones. Then the tool returns an output raster with only the cells containing the calculated zonal statistic value for each zone, and a feature class where cells in the first output are converted to either points or polygons. This tool is useful for pinpointing where extremes are occurring within the defined regions.
Tools from the previous release
The following tools from the previous release have been enhanced to work in ArcGIS Pro.
- Create Dendrogram
This tool generates a dendrogram—a tree diagram that shows the hierarchical relationship between spectral classes in a signature file. It reads a signature file (.gsg) and builds a visual representation of class distances that can be used to assess cluster separability. By analyzing the dendrogram, you can determine whether the clusters identified in the signature file are distinct enough to give a good classification result.
- Draw Signatures
The Draw Signatures tool creates a PDF with ellipses that represent the covariance structure of spectral classes in a signature file. It allows users to visualize overlap between classes by plotting ellipses for all band combinations. The ellipses outline the boundary of the sample distribution defined by a specified number of standard deviations.
- Erase Raster Values
The Erase Raster Values tool can be used to selectively remove or replace raster cell values using a mask. Both feature and raster masks are supported. You can assign NoData or a specific value to the affected cells. It streamlines workflows that previously required multiple steps using Con and SetNull tools.
- Maximum Upstream Elevation
This tool computes the highest upstream elevation for each cell. It uses elevation and flow direction rasters and traces flow paths to assign the maximum elevation reached upstream. This tool is particularly useful for modeling potential debris flows from extreme rain events in mountainous areas affected by wildfires.
- Peak
The Peak tool identifies local high points in a surface raster. It serves as the inverse of the Sink tool—well-known in hydrological analysis for detecting depressions in elevation data. The tool locates peaks by first inverting the elevation raster and computing the flow direction for that surface. Then it identifies sinks, which correspond to peaks in the original surface. Cells with maximum elevations within these inverted sinks are extracted and saved as a raster with unique values for each peak.
- Viewshed Along Path
The Viewshed Along Path tool calculates visibility along a linear path, simulating a moving observer with a limited field of view. While traditional viewshed analysis typically assumes a full 360-degree field of view, this tool restricts the visibility angle, simulating scenarios such as a driver navigating a parade float with constrained visibility. It densifies the path, converts vertices to observer points, assigns precise azimuth and vertical view limits to each observer point, and then computes visibility accordingly.
How to access the tools
You can access and use the tools in two ways:
- Download locally
The Spatial Analyst Supplemental Tools toolbox is available for download here:
Spatial Analyst Supplemental Tools
Once you have downloaded the file to your machine, extract the contents of the zip file. Then, in the Catalog pane in ArcGIS Pro, browse to the location you extracted the files to, or optionally add a folder connection. You should now see the toolbox containing the script tools.
- Add to your ArcGIS Pro project from ArcGIS Online
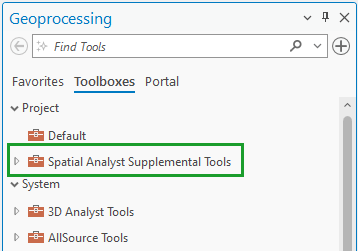
In ArcGIS Pro, sign in to your ArcGIS Online account and set it as the active portal. Then search the portal for Spatial Analyst Supplemental Tools. Optionally, filter the search results to only the Item Type: Tools to make it easier to find. After you have located the Spatial Analyst Supplemental Tools v2.0 for ArcGIS Pro toolbox, right-click it and select Add To Project. You can now access the toolbox from the Toolboxes tab in the Geoprocessing pane. This will also add the toolbox to the project’s Toolboxes, and add a folder connection to the root of the folder containing the toolbox.

Requirements:
ArcGIS Pro and Spatial Analyst extension.
Version history
- v2.0—Developed the toolbox for ArcGIS Pro. Added the new tools Create Flood Simulation Raster and Locate Zonal Statistics, along with the Create Dendrogram, Draw Signatures, Erase Raster Values, Maximum Upstream Elevation, Peak, and Viewshed Along Path tools from the previous version.
Removed Storage Capacity, Tabulate Area 2, Zonal Statistics as Table 2, and Filled Contours tools since these functionalities are now available in the Spatial Analyst toolbox in ArcGIS Pro. - v1.4—Added the Storage Capacity tool.
- v1.3—Added the Tabulate Area 2 tool and Zonal Statistics as Table 2 tool, and added a new parameter to the Maximum Upstream Elevation tool.
- v1.2—Added the Erase Raster Values and Zonal Statistics as Table for Overlapping Polygons tools.
- v1.1—Updates for ArcGIS 10.1 SP1.
- v1.0—The Create Dendrogram, Draw Signatures, Filled Contours, Maximum Upstream Elevation, Viewshed Along Path, Peak, and Viewshed tools were made available.
For more information on the previous versions of the Supplemental tools, have a look at this blog post:


Article Discussion: