Featured trainingNew Course | Introduction to Indoor Mapping Using ArcGIS IndoorsLearn more about the course
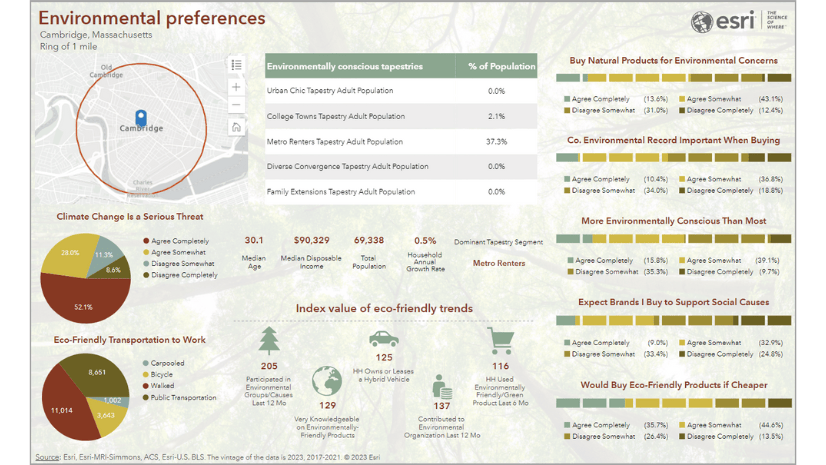
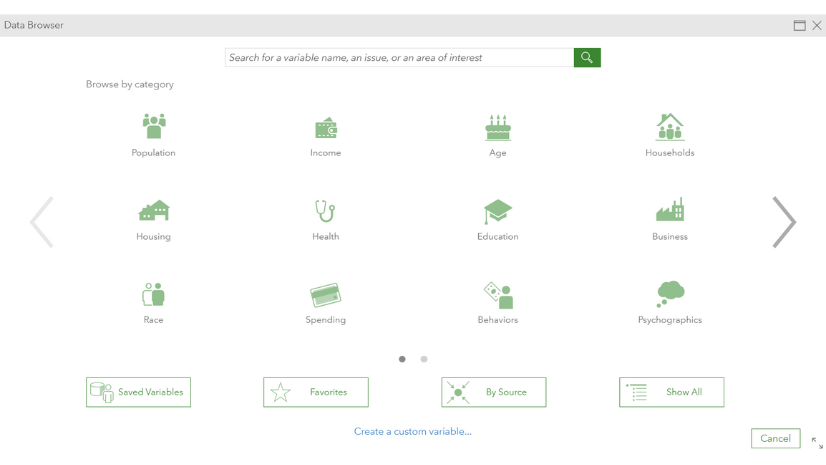
June 27, 2023 | Multiple Authors | Business What’s new in the ArcGIS Business Analyst data browser (June 2023)
April 28, 2023 | S David | Analytics Map service areas with thresholds using ArcGIS Community Analyst
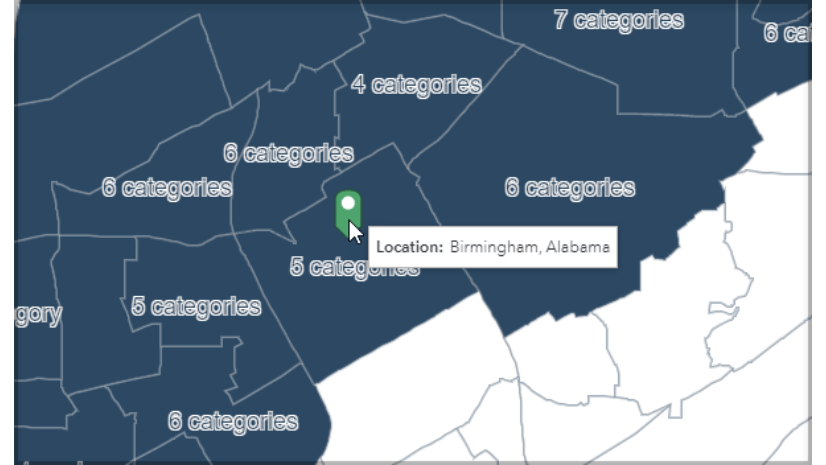
March 20, 2023 | S David | Analytics Use the data browser to enhance analysis for nonprofits in ArcGIS Community Analyst