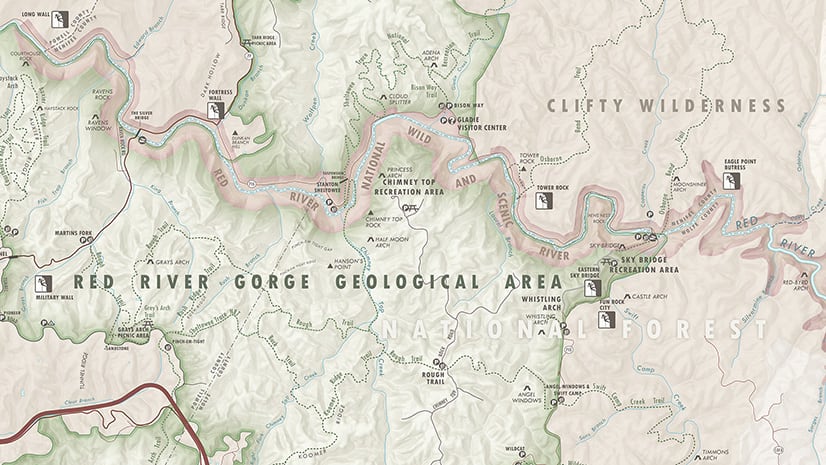
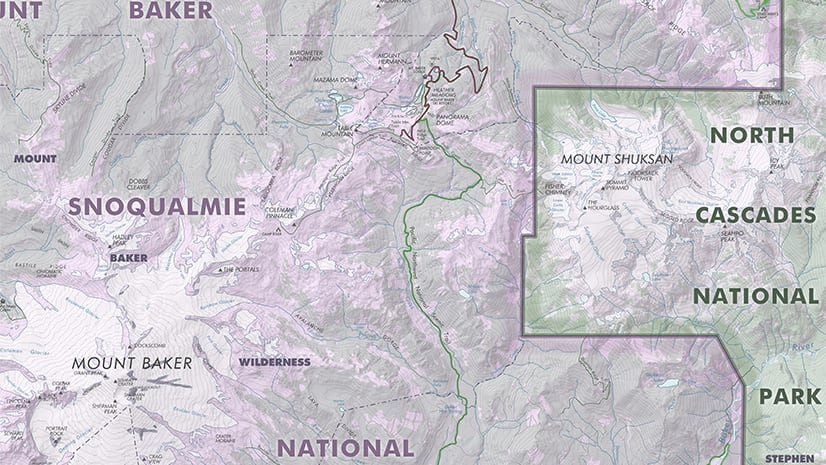
Rock climbing and mapping are two of my greatest passions, and it is a true joy when I get to fuse those two obsessions into a map focused on rock climbing. This 12 x 13.5 inch monochrome map shows rock climbing areas within a one-, two-, and three-hour drive of Canada’s beautiful west coast metropolis, Vancouver, British Columbia. To differentiate between crags and climbing areas within and outside the three-hour zone, the crags outside the zone have been visually subdued1. The drive time polygons also all use the same hue, differentiating in opacity.
In this post, I’ll share the steps I followed to generate these drive time areas from Vancouver, B.C. all within Adobe Illustrator via Esri’s mapping tool created for Adobe Creative Cloud©. For information on some of the aesthetic design choices for this rock climbing map, check out this post on my personal site.
Esri’s ArcGIS Maps for Adobe Creative Cloud just released version 1.4, which includes a lot of new features including ArcGIS Online’s Drive Time Areas analysis tool, allowing users to calculate travel times and distances from a particular point or set of points. There are many possible applications for this useful feature. For example, users can create polygons indicating how far an emergency vehicle can travel in 10 minutes from its dispatch location. Now that this travel time analysis tool has been added to Maps for Adobe Creative Cloud (M4CC), users can add these polygons to their map inside Adobe Illustrator. In fact, there are many different types of travel analyses mappers can do, including pedestrian, trucking, rural driving, and more. You can find out more about Esri’s travel analysis tool here.

1. Draw the mapboard
For my rock climbing map, I wanted the largest drive time polygon (three hours from Vancouver) to help form my map extent, which users set up in M4CC by drawing the mapboard. Drawing a mapboard that is supposed to encompass a three-hour drive time from a particular spot takes some familiarity with the region. You cannot know exactly how far you can travel for three hours in any direction without first running the Drive Time tool. And you cannot run the Drive Time tool without first drawing the mapboard. Luckily, you can adjust the mapboard exactly where you want anytime in the map-making process before you sync/download the map. So, if the map’s extent needs to be adjusted after running the Drive Time tool, that’s easy to do. Remember once you sync/download2 your map, the map extent cannot be changed. You can read more about the M4CC Mapboard tool here.
2. Add the data from which the travel times will be generated
You need some starting-point data (yes, it needs to be point data) to run the Drive Time tool. I used the great Add Places feature in M4CC Compilation window to get the Vancouver point to run the travel time tool. To do this, once I finished drawing my mapboard in step 1 I went to the Compilation window, and then:
- Click “Add Content” button at top, and select “Add Places” from the options.

- Type “Vancouver” (or the place you are searching for… could be a business name, address, city, etc.) in the search bar.

- Select the appropriate option. For my map, I chose “Vancouver, British Columbia, CAN” to return a list of results from which to add to my map.
- I clicked the “+” button from the top option “Vancouver, British Columbia” to add a point in that location to my map.

This added a point in the center of Vancouver, British Columbia to my map. This will be the point that I use to calculate my travel time polygons.
3. Create Travel Time areas
The final step to add these travel time polygons (or travel distance polygons, if that is what your map calls for) to your map is to use the “Visualize Travel Time” tool (comes from ArcGIS Online’s Drive Time Areas analysis tool), newly available in M4CC.
- Hover over the ellipse button on your point layer, and select “Visualize Travel Times” from the options.

- Visualize Travel Times offers many options for calculating travel times and distances. Because my map shows the areas that a person could drive to within 3 hours of my Vancouver, B.C. point, I chose “Driving Time.” If I wanted to show the areas where a person could drive to in 60 kilometers, I would have chosen “Driving Distance” instead.

- Enter the time(s) that you want to map from your starting point. If you only want to display one travel time polygon, you can enter the number of seconds, minutes, or hours that you want to show, and then choose the appropriate time unit. The example below shows what you would enter if you wanted to show one 5-minute drive time polygon around the Vancouver point.

Because my map called for 3 polygons: 1-hour, 2-hour, and 3-hour drive times, I entered these values with a space between each, and then selected “Hours” as shown in the image below. After entering your desired travel polygon parameters, click “Apply” and in a few moments, you’ll have your travel time polygons added to your map in the Compilation window.


Of course, now you get to add all the other contextual data to illuminate your map’s story. For my rock climbing map, I added points representing climbing areas, informed by Mountain Project, BC provincial parks, US and Canada national parks, a world hillshade layer, and transportation layers. A lot of the data I used came from the VectorStreetMap layer available to all M4CC users. I also applied the gorgeous BC Environment Albers projection by using M4CC’s projection settings.
I had so much fun making this intentionally monochrome map. If you’d like to read about some of the design process behind this map, you can check out this latest post on my personal site, where I write about mapping.
1 Note that while many of the climbing areas are within three hours of Vancouver, not all the crags and peaks within that area are necessarily within three hours. Nevertheless, their crags are listed in the bold (see North Cascades, for example).
2 Downloading a map in M4CC is also referred to as “syncing” since information from the map you are building is embedded into the Illustrator file itself. this allows users to re-load their map in the extension just by opening the synced Illustrator file. For more details on syncing a map, check out this documentation.


Commenting is not enabled for this article.