Categorical raster management has been greatly enhanced at ArcGIS 10.1. Multiple rasters that have the same classification scheme can be ingested in a mosaic dataset, share one attribute table and colormap, can be published as a single image service, and can be used as a single dataset. Below is a workflow of how to achieve this.
1. Use Create Mosaic Dataset tool to create a new mosaic dataset
- Specify the mosaic dataset name
- Specify the mosaic dataset coordinate system
- Expand the Pixel Properties section
- Set “Number of Bands” = 1
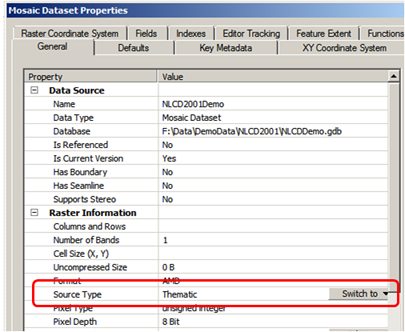
2. Set Thematic as the Source Type, on the Mosaic Dataset Properties page:
- In the Catalog Window, right-click your newly create mosaic dataset, and click Properties
- On the General tab, switch Source type to “Thematic” and then Apply

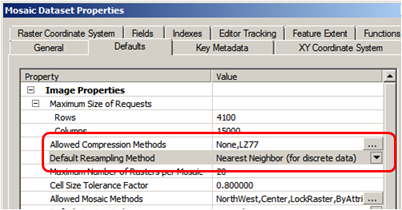
- On the Defaults tab, make sure the default compression is either “None” or “LZ77”. It may be a good idea to remove “JPEG” and “LERC” from Allowed Compression Methods;

- Also on the Defaults tab, change default resampling method to “Nearest Neighbor”
- Click Apply
3. Use Add Rasters to Mosaic Dataset tool to add categorical data into the mosaic dataset
- Specify the mosaic dataset
- Keep the Raster Type as Raster Dataset
- Navigate to the Workspace that contains all your categorical data
- Click OK to run the tool
4. In some cases, source rasters may have NoData pixels around the edge (usually 0 or 255) that needs to be filtered out – use the Define Mosaic Dataset NoData tool.
- Specify the mosaic dataset
- In the Band for NoData Value dropdown, choose Band_1
- Specify the NoData value for band 1 (most likely 0).
- Click OK to run the tool
5. Use the Calculate Statistics on the mosaic dataset. This will give mosaic dataset statistics and histograms.
6. Add the Attribute table function
- In the Catalog Window, right-click on the mosaic dataset, and click Properties
- Click on the Functions tab
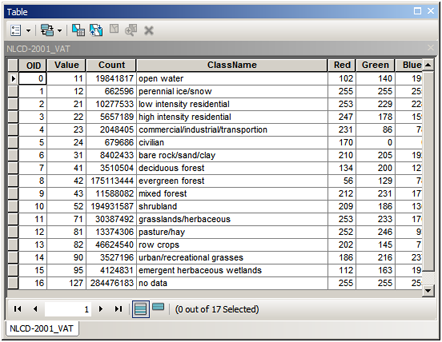
- Insert “Attribute Table function” on top of “Mosaic function”, and point to a raster attribute table file (.dbf). A “raster attribute table” contains pixel value and category name mapping that you can show in legend, with “OID”, “VALUE”, “COUNT” fields and optional “Red”, “Green”, “Blue” and class type columns that ArcGIS will recognize and use to symbolize when display.

- If no DBF exists, then you will need to build a raster attribute table (not covered in this particular blog)
7. Use the Build Overviews tool to create overviews
8. Optionally you can publish the mosaic dataset as an image service. The raster attribute table, statistics and histograms will be streamed by the image service through its SOAP and REST APIs along with categorical imagery. You can use unique value and classified renderers on both the mosaic dataset and the image service.
Important notes:
Please note the raster value attribute table is used by the mosaic dataset but not stored in the mosaic dataset. So whenever you need to move the mosaic dataset, you need to go to mosaic dataset’s function tab to point to the correct/accessible raster attribute table location.
Also please keep in mind, ArcGIS Server account need access to mosaic dataset, source rasters, and the raster attribute table.
Contributed by: Wenxue Ju
Commenting is not enabled for this article.