In his demonstration, Shreyas highlights the new autoscaling capabilities for ArcGIS Enterprise on Kubernetes. This is an incredibly powerful new feature that allows administrators to configure and deploy production systems that respond to unexpected performance demands with minimal intervention and overhead. For IT administrators—who often need to maintain complex systems and ensure they run smoothly—autoscaling can help them monitor their systems and scale resources when needed.
Load test with Apache JMeter
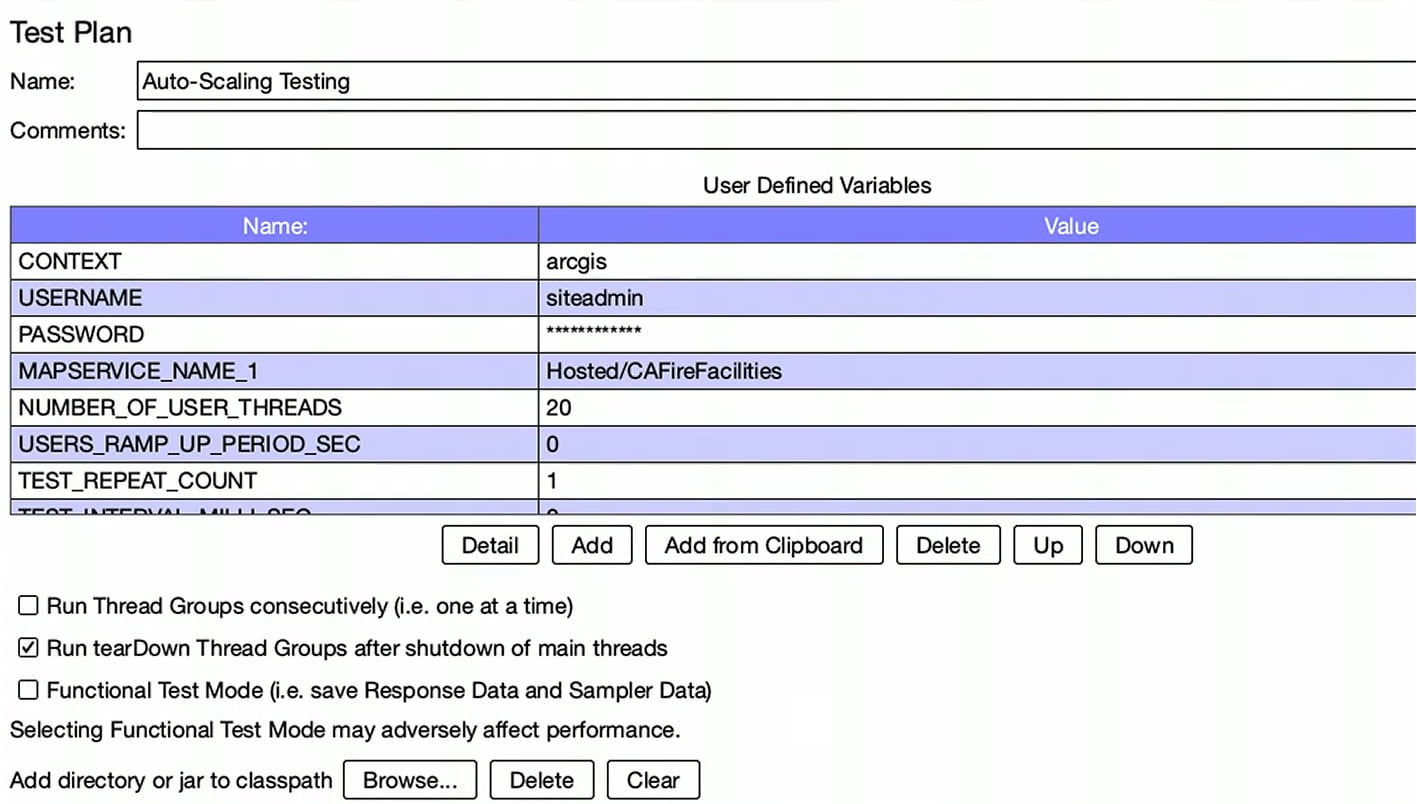
Now that the organization has been created, Shreyas needs test how it responds to unexpected performance demands to make sure that it’s ready for production. To do this, Shreyas created an Apache JMeter project. JMeter allows Shreyas to perform a load test to evaluate how his deployment, and the autoscaling configuration, performs under pressure. The JMeter project he’s created will simulate 20 concurrent, active users, all of whom are interacting with a hosted feature service in the organization.

Autoscaling configuration settings
ArcGIS Enterprise on Kubernetes’ autoscaling feature builds on the foundation of Horizontal Pod Autoscaling, which updates a workload resource to automatically scale the workload to match current demand.
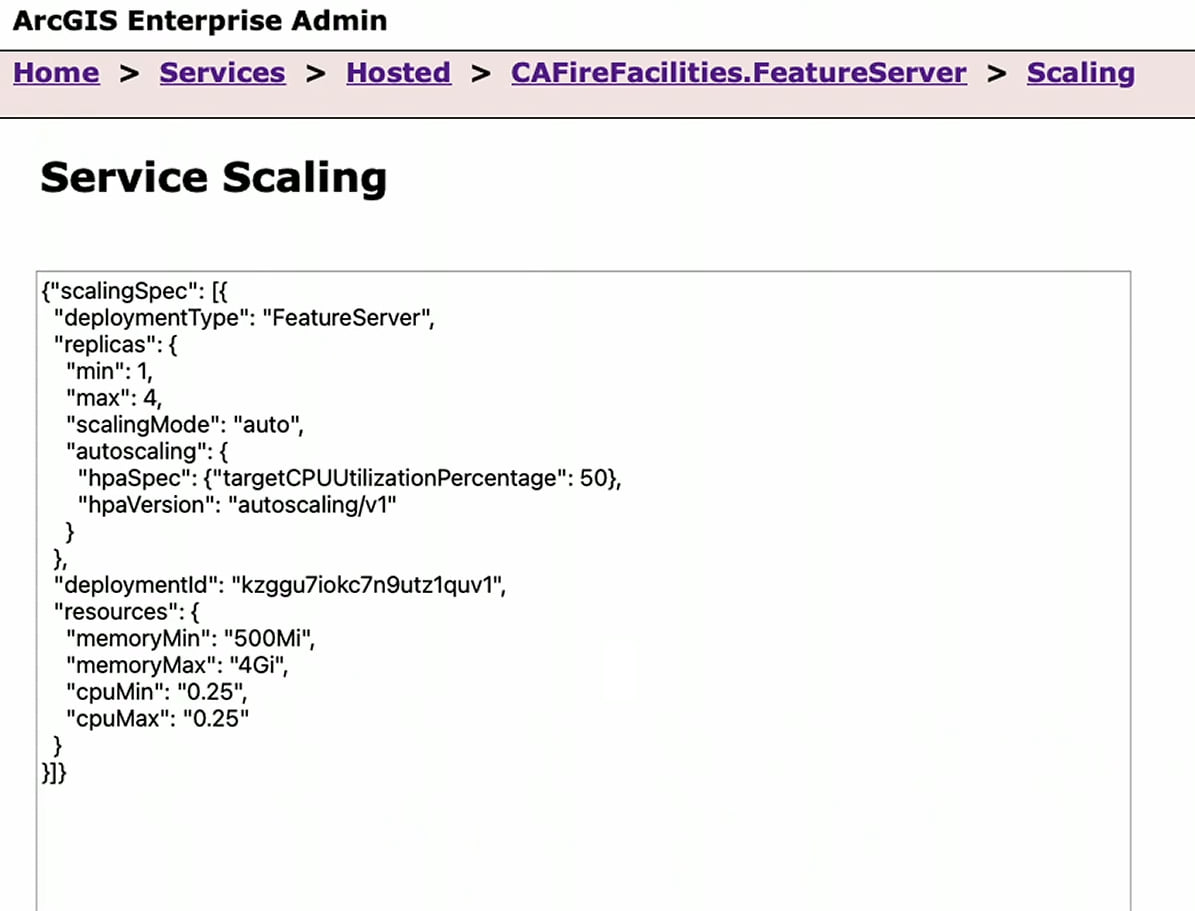
Shreyas set the service scaling using the ArcGIS Enterprise Admin API to scale from one Pod to four if the CPU threshold crosses 50%. While the load test is happening, ArcGIS Enterprise on Kubernetes is in the background continuously monitoring the Pods’ CPU utilization. If it crosses the threshold, the system will scale the number of Pods up according to the configuration values. If the cluster is running low on resources, and cannot accommodate adding additional Pods, Enterprise on Kubernetes will engage the cluster provider and trigger the addition of new compute nodes. When utilization drops, and the additional resources are no longer needed, the system scales itself back down to its default state.

Monitoring system performance with Grafana
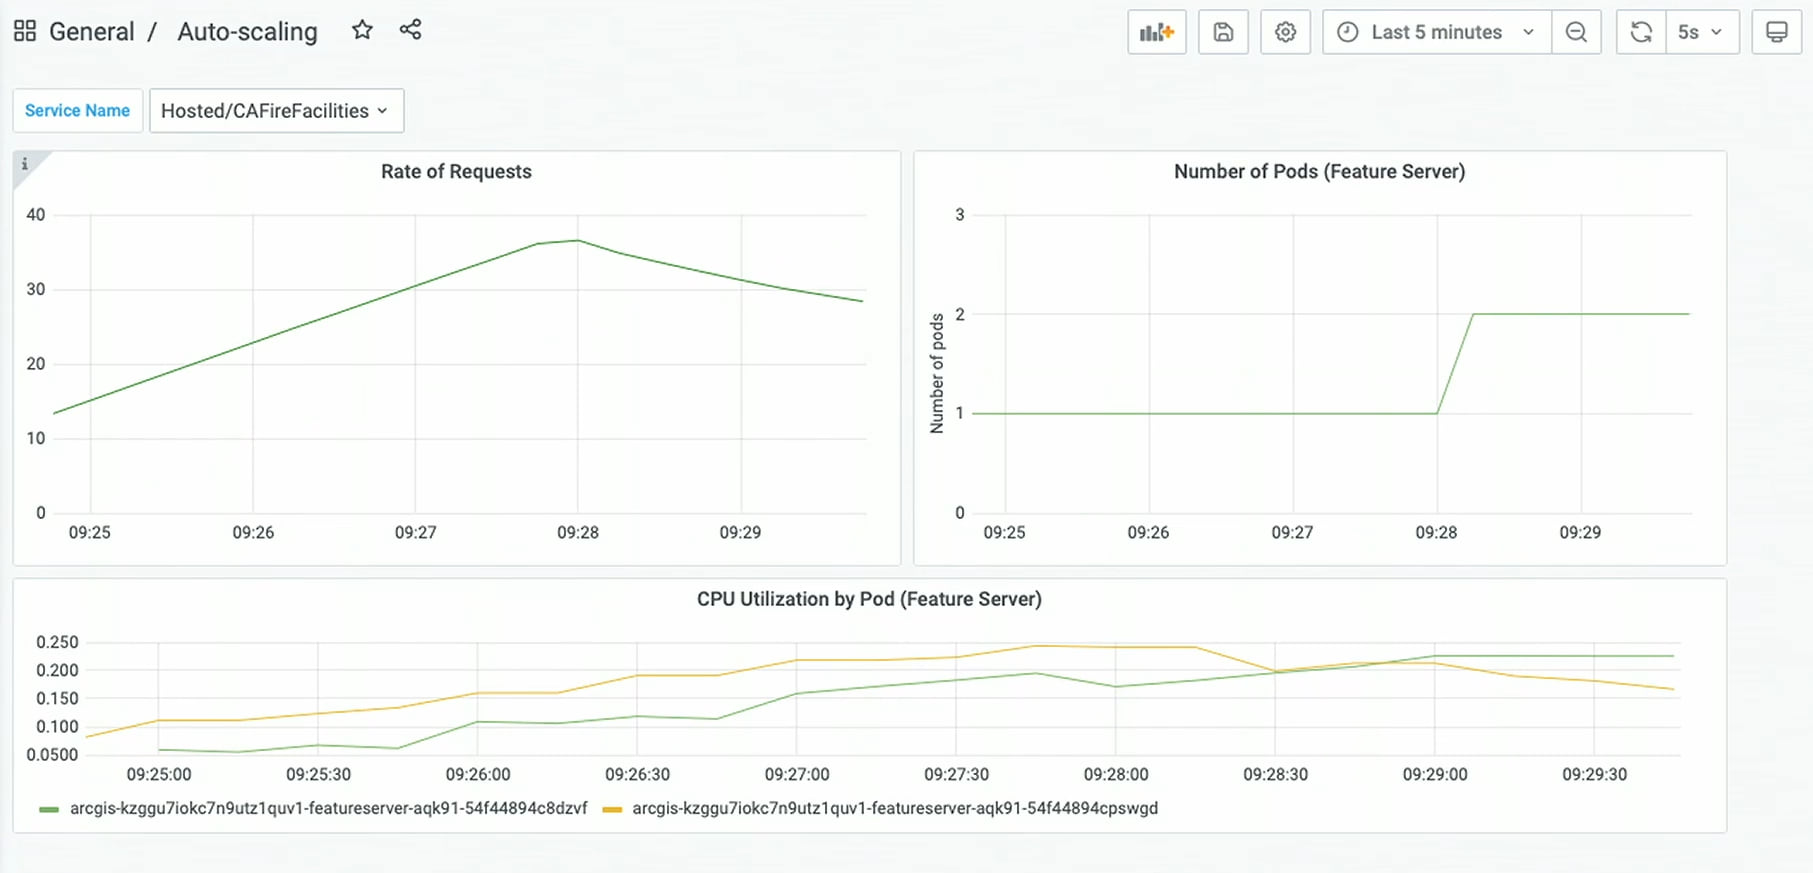
Grafana, a metrics visualizer, is part of the out-of-the-box ArcGIS Enterprise on Kubernetes deployment. Using Grafana, administrators can author dashboards to visualize their system’s data and better understand their organization’s health. As shown below, Shreyas’ dashboard depicts three key pieces of system information: the rate of requests, the number of Pods or instances of the feature server, and the CPU activity for all Pods. Once the test begins, and the load increases, we can see that the dashboard updates accordingly, showing how the system is performing under the increased load.

During the load test we can see that Shreyas’ organization did not block new requests. Instead, new Pods were created to handle the additional demand in line with the values set up in the service scaling configuration. We can also see that CPU utilization is at comparable levels to those seen before the test. This means that, though the system is being subjected to heavier usage, the load is being well distributed across all Pods.
Conclusion
With this demonstration, Shreyas showed how the system automatically adjusted to the organization’s needs. To learn more about the features showed in this demonstration, as well as to learn about other administrative tasks that can be performed in ArcGIS Enterprise on Kubernetes, see the following resources:
- Service Scaling
- Manage service deployments
- View statistics dashboard using the metrics viewer
- Access the metrics API
Missed some of the demonstrations presented today? Check out the overview blog:

Commenting is not enabled for this article.