When the unexpected happens in your production environment, you hope that it is resilient enough to remain operational and recover as quickly as possible. With an ArcGIS Enterprise on Kubernetes deployment, organizations have access to multiple features that can provide this level of resiliency. In their plenary demonstration, Chris and Bill highlight some of these features, including ArcGIS Enterprise on Kubernetes’s support for the multiple availability zone deployments.
Configuring a highly available deployment
For their demonstration, Chris and Bill have set up a highly available deployment that will be undergoing a chaos test. While an ArcGIS Enterprise on Kubernetes deployment has built-in high availability, Chris and Bill are also leveraging a number of other features to reduce the amount of downtime, data loss, and improve resiliency.
Cloud native object stores
Starting at the 11.2 release, ArcGIS Enterprise on Kubernetes organizations can use cloud native services to integrate cloud object stores. Cloud object stores act as the organization’s object store or backup store location. This aids in increasing reliability and resiliency while also reducing the demand on in-cluster resources.
Multi-AZ deployments
Also starting at 11.2, ArcGIS Enterprise on Kubernetes deployments can deploy their Kubernetes cluster across multiple availability zones. By using topology spread constraints, administrators can control how scheduling occurs across the cluster. For Chris and Bill’s deployment, each availability zone becomes the separation boundary between replicas of each workload.
Enhanced availability architecture profile
The enhanced availability architecture profile is designed for use in business or mission-critical production environments and provides the highest level of availability, as it includes increased and expanded redundancy across critical pods. If an organization is configured to use multiple availability zones, the enhanced availability profile is the only profile that guarantees adequate coverage for all stateful workloads in the case of an availability zone failure.
Testing reliability when faced with failure
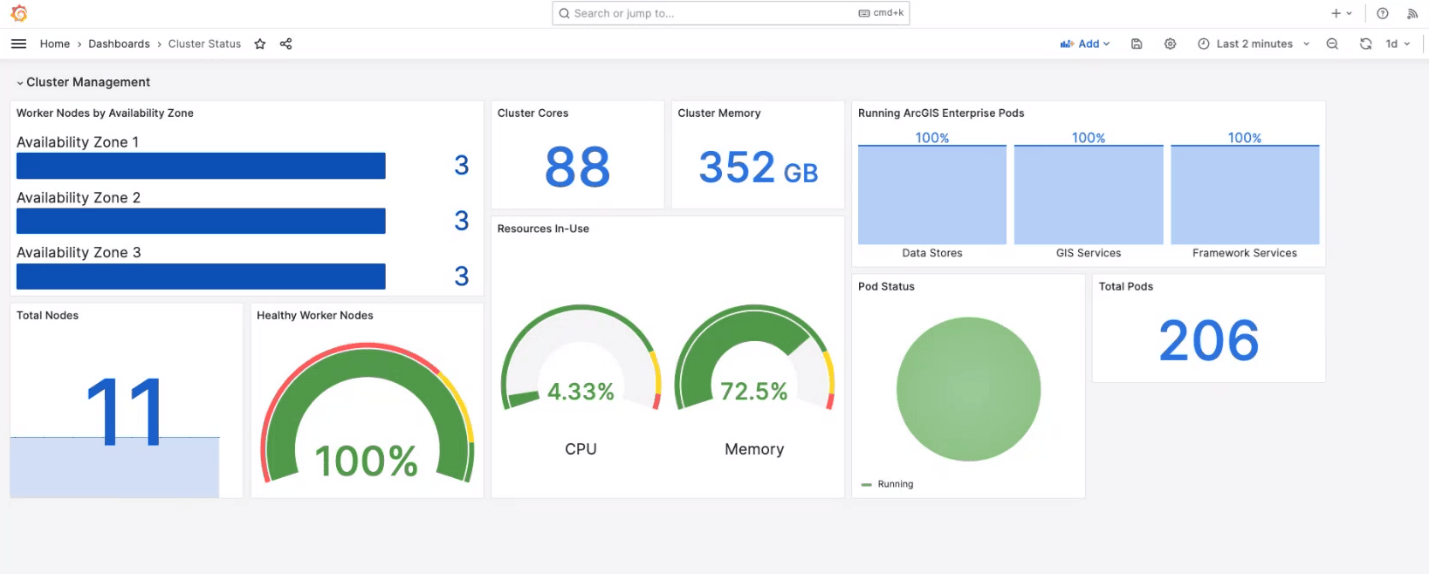
Chris begins his demonstration by showing the current state of his organization. Due to the interplay between the multiple availability zone deployment, enhanced availability profile, and cloud native object store, the organization is set up to be able to withstand a significant outage.
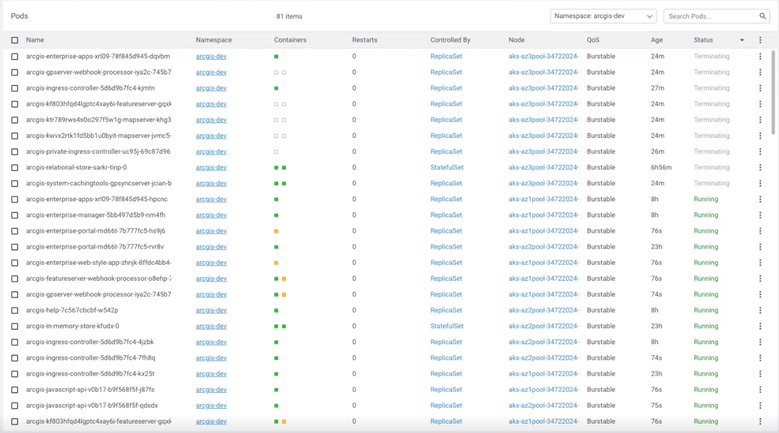
To put this to the test, Chris stops one of the availability zones, disrupting the cluster. As a result, machines have terminated, and numerous pods are shifting from a running to pending state.
Observability and monitoring after failure
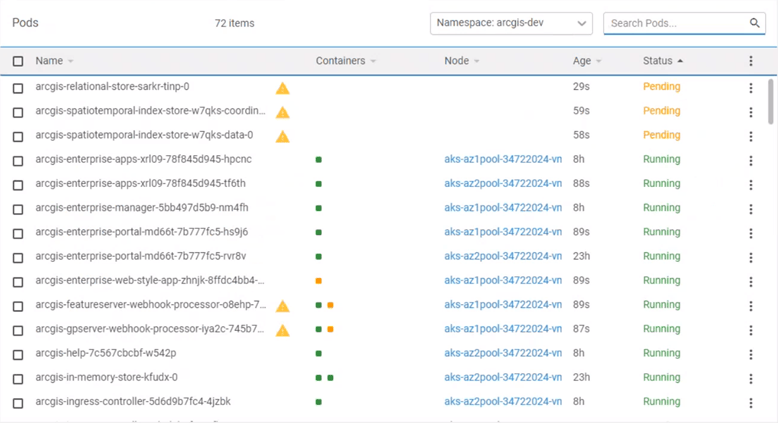
With Chris’s chaos test implemented, Bill now needs to evaluate the impact of the zone’s outage. From the number of pods in a pending state, we can see that Kubernetes is attempting to rebalance after the loss in capacity.
Next, Bill moves to check ArcGIS Enterprise Manager to check if there are any critical logs. The lack of critical logs shows that the enhanced availability architecture profile is providing the expected resiliency.
Bill then moves on to check perform a basic health check on the core framework services, which shows that the relational store health check has failed.
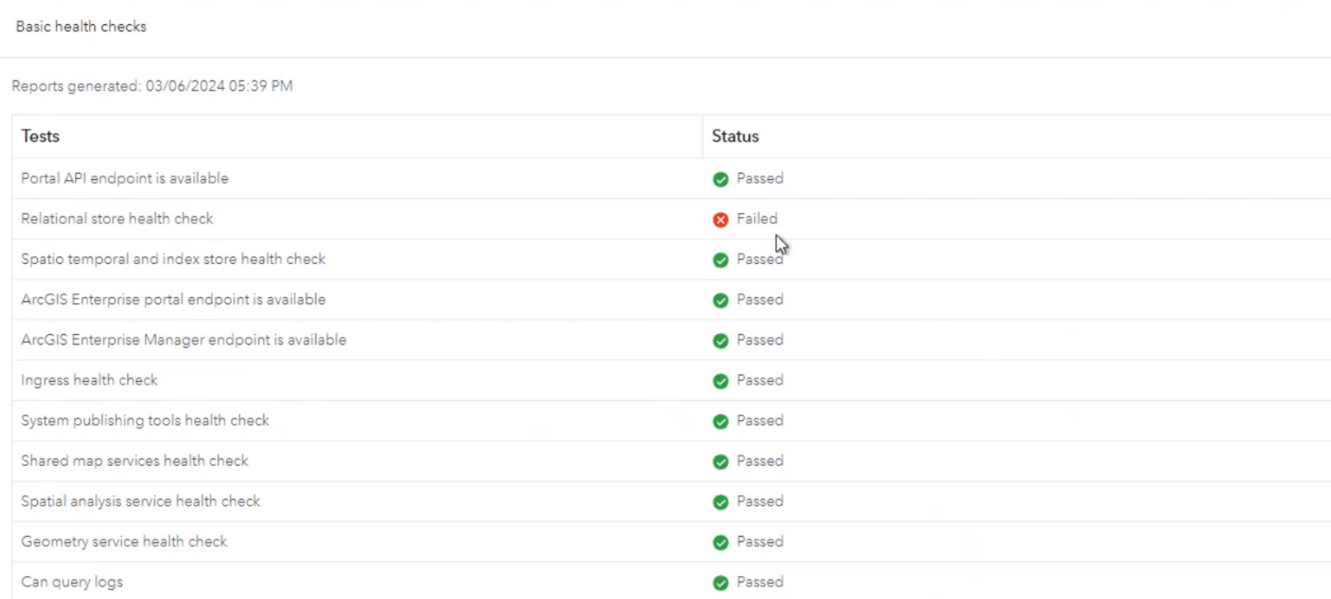
When Bill validates the relational data store, it returns a warning status. This means that the primary relational store is healthy, but the standby is not.
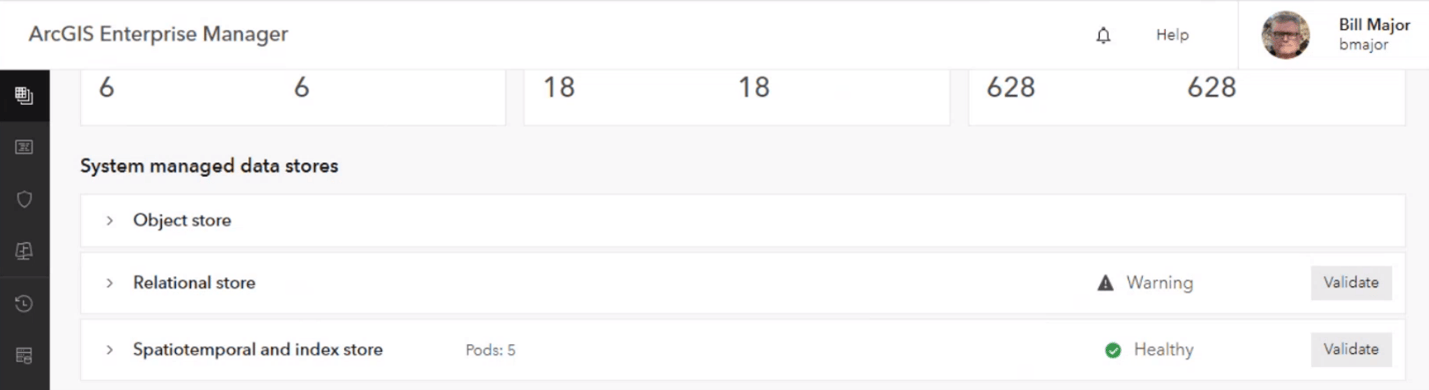
Though not highly available, the organization remains available in this degraded state . Bill moves on to monitoring the organization to track current performance through his Grafana dashboard.
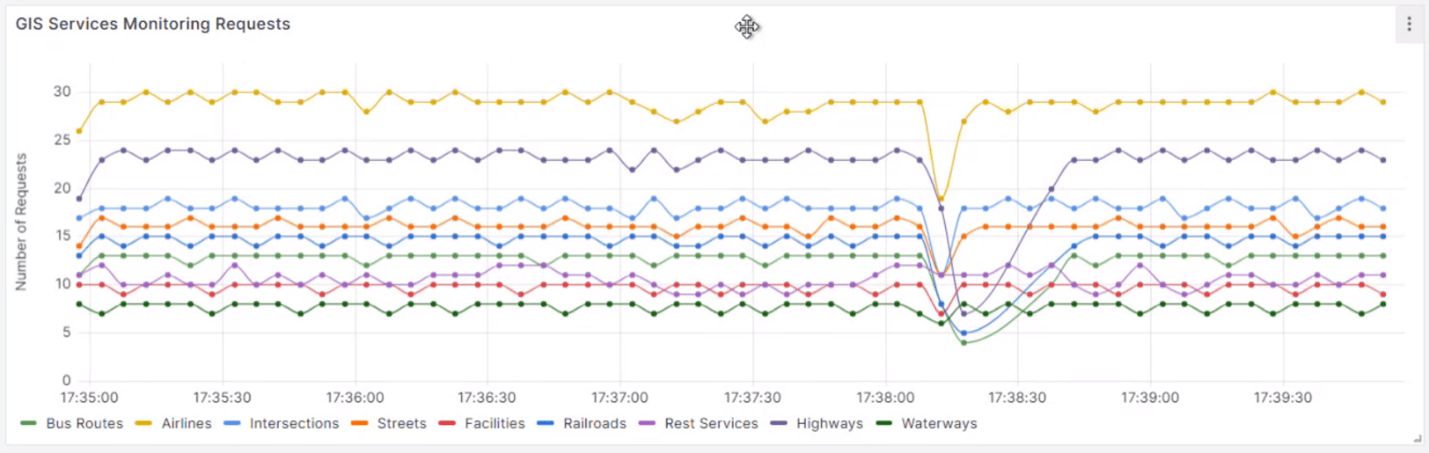
The first chart in the dashboard shows the successful HTTP requests over time. This chart shows that while there is an impact to throughput while Kubernetes is rebalancing, all services are continuing to respond and are returning to their expected performance.
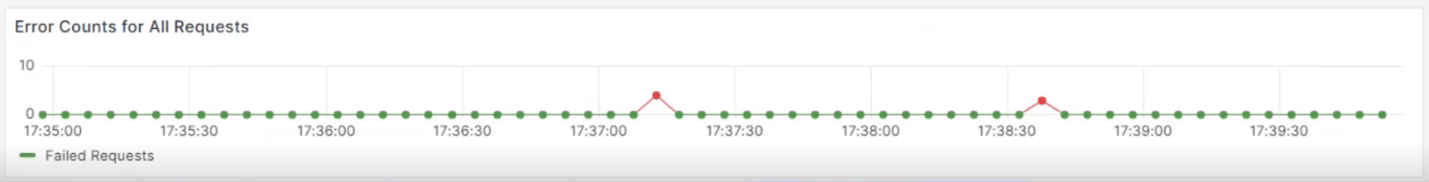
The second chart shows request failures. While some errors have occurred, this chart also shows that critical services remain operational even while Kubernetes is working to rebalance after the outage.
Conclusion
During their presentation, Chris and Bill showed how ArcGIS Enterprise on Kubernetes remains reliable, resilient, and operational, even when faced with critical failures.
For more information on ArcGIS Enterprise on Kubernetes, and to see if this deployment solution is the right one for your organization, use the links below to reference our documentation and other blogs:


Commenting is not enabled for this article.