This is a companion blog for a plenary demonstration from the 2025 Esri Developer & Technology Summit plenary.
In his plenary demonstration, Bill highlights three different lenses of observability possible with ArcGIS.
Organizational observability
The first of the three lenses is organizational observability.
ArcGIS Dashboards creates configurable dashboards to visualize and analyze data, helping organizations gain valuable insights and communicate those insights to customers, other organization members, and stakeholders.
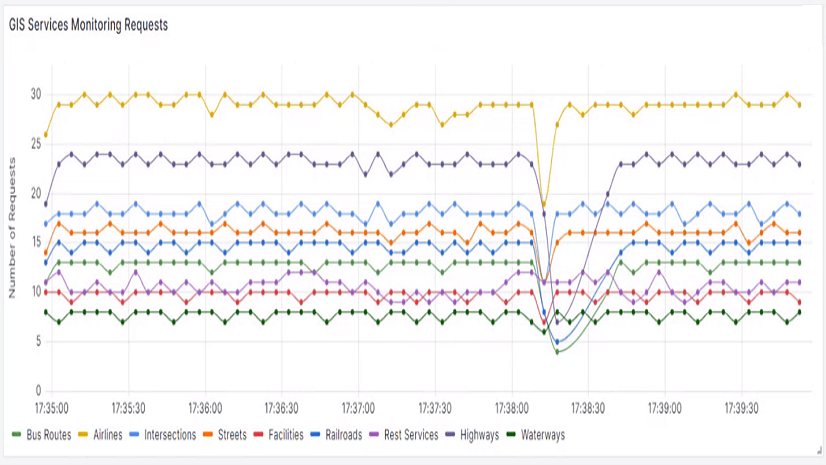
For his demonstration, Bill showcases a dashboard powered by ArcGIS Notebooks. This dashboard includes several widgets that return insights on the following logistical information:
- The user login rates (per hour)
- The number of active, scheduled notebook tasks
- The remaining entitlements available to organization members
- The users most frequently accessing feature services
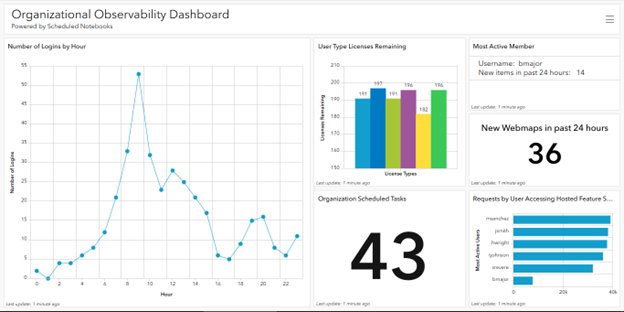
Bill takes a moment to touch on one specific widget: Requests by Users Accessing Hosted Feature Services. This widget uses ArcGIS Server usage reports and ArcGIS Notebooks to display its data.
Usage reports provide ArcGIS Server usage data for specific resources. This report uses a new metric that monitors the number of requests made by individual users to hosted feature services over a set period.
Bill created a Python-powered notebook that queries the usage report for information. Using this notebook, he creates reports of requests made to services, both by date and by user.
With these tools, administrators can make better, more informed decisions to optimize their environments.
Administrative observability
Next, Bill showcases how ArcGIS aids with administrative observability. To demonstrate, Bill switches to the Grafana dashboard of an ArcGIS Enterprise on Kubernetes deployment. The Grafana dashboard shows a wide range of Prometheus metrics, such as CPU usage and throttling and service-level metrics.
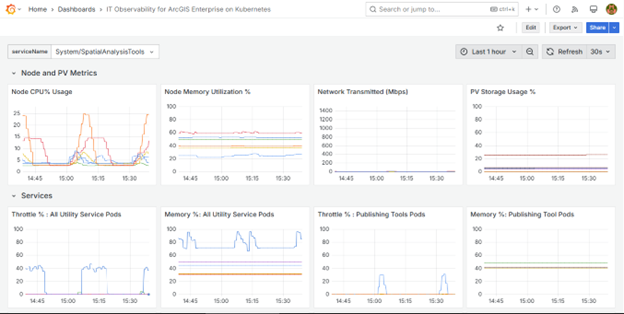
Bill demonstrates how IT administrators can use these metrics to identify and respond to issues as they arise.
He created a notebook for an ArcGIS Enterprise on Kubernetes deployment that helps him query logs. Specifically, the notebook queries all INFO-level logs generated during an earlier publishing event for a hosted feature service.
He identifies a specific log he knows is generated at the beginning of the publishing workflow. The log includes a request ID, which he can use to refine the logs to show only logs associated with a specific request. These logs come from different components of an ArcGIS Enterprise on Kubernetes deployment, such as the Sharing API and Publishing Tools GPServer. After filtering the logs down using the request IDs, Bill can more easily identify any logs that can help diagnose issues related to the services within his deployment.
By performing this workflow, Bill shows how log traceability can help streamline an IT administrator’s ability to troubleshoot problems with the health and performance of their infrastructure.
Compliance observability
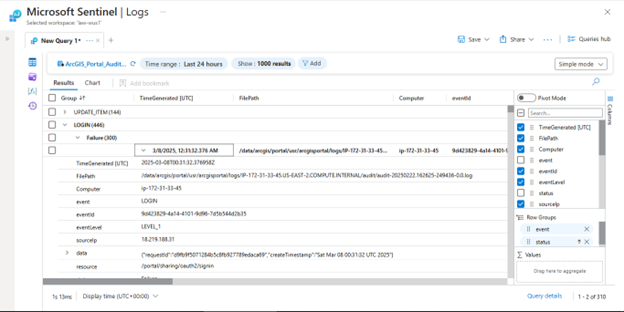
Finally, Bill demonstrates the third lens of observability. ArcGIS Enterprise now offers the ability to export audit logs. Audit logs are detailed event logs used to monitor changes made to an ArcGIS Enterprise deployment. Audit logs are a tool that helps identify the cause of critical or breaking changes that occurred.
Notably, audit logs are processed by Security Information and Event Management (SIEM) tools to generate an audit trail, track trends in user activity, and monitor and address any security threats or vulnerabilities.
For this portion of the demonstration, Bill shows an ArcGIS Enterprise organization that uses an agent that ingests these audit logs into an SIEM. Using the SIEM, Bill can query for specific patterns, such as excessive failed login attempts. He can also set up alerts for specific patterns so that he receives near real-time when events occur.
With this demonstration, Bill showcased some of the tools security engineers have to monitor access to deployment resources, and how that access is happening.
Conclusion
Throughout his demonstration, Bill shows how different forms of observability exist within ArcGIS, and how that observability plays a crucial role in enhancing an organization’s operational efficiency.
To learn more about what was discussed in this blog, see the documentation below:


Commenting is not enabled for this article.