Earth’s surface is dynamic and perpetually changing; therefore, it is essential to detect the changes to facilitate the analysis and protection of our terrestrial ecosystem.
At the Developer Summit 2021 plenary, Hong Xu demonstrated how you can use LandTrendr to track changes in forest cover and analyze timber harvesting patterns to detect illegal logging.
Watch the plenary video below, and then read the rest of the blog for a summary of the processes that Hong Xu explored in her demo.
For the demo, Hong Xu used LandTrendr in ArcGIS Notebooks to detect changes in the forests of the West Cascades ecoregion in Oregon.
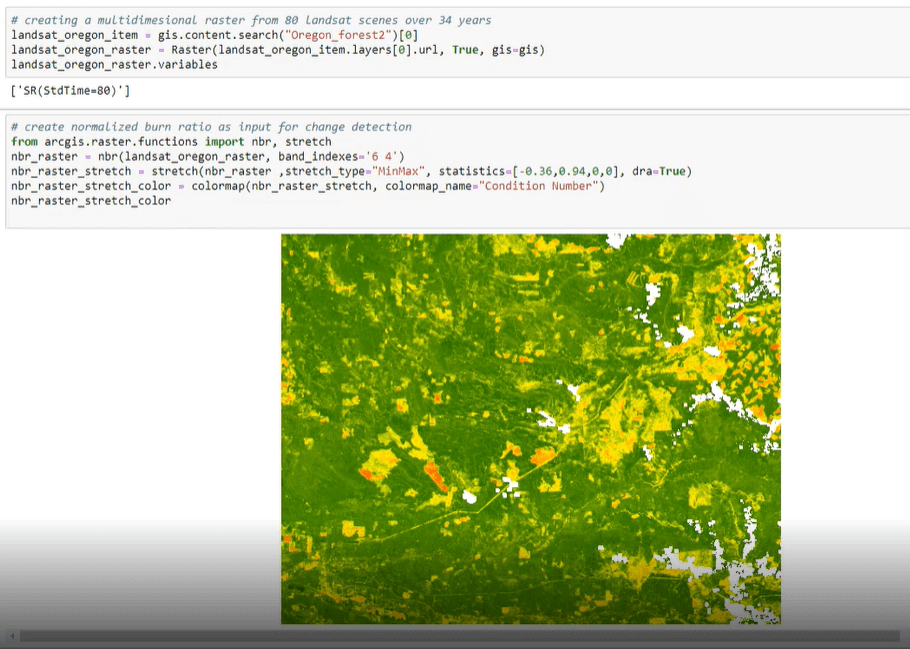
First, she created a multidimensional raster from 80 Landsat scenes collected over 34 years from 1984. The multidimensional raster was then used to generate the normalized burn ratio, which uses the near-infrared (NIR) and short-wave infrared (SWIR) bands to identify burned forest areas and calculate the burn severity.

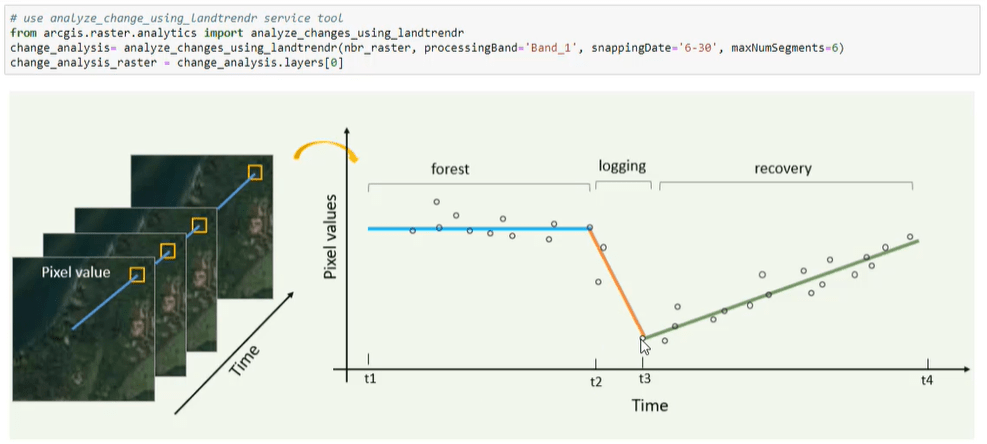
The normalized burn ratio raster was then used in the Analyze Changes Using LandTrendr raster analytic function to assess changes in pixel values over time. The function uses the Landsat-based detection of trends in disturbance and recovery (LandTrendr) algorithm to break down each pixel’s history into a time series trajectory, which is then segmented to illustrate distinct periods: periods of no change, change, and recovery from change.

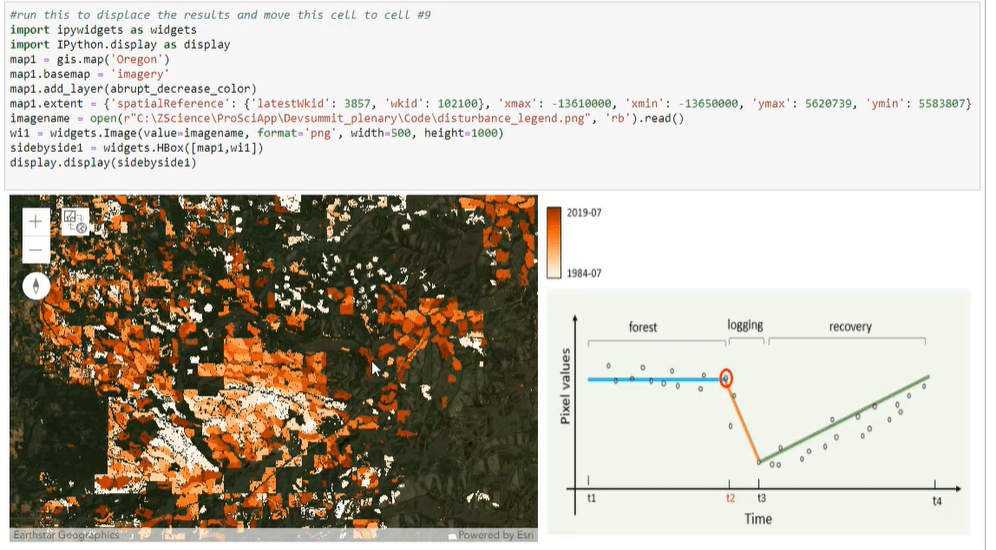
Next, Hong Xu used the resulting output change analysis raster in the Detect Change raster analytic function to generate a raster containing pixel change information. In the new raster, darker shades indicate forest areas with logging activity in recent years and vice versa.

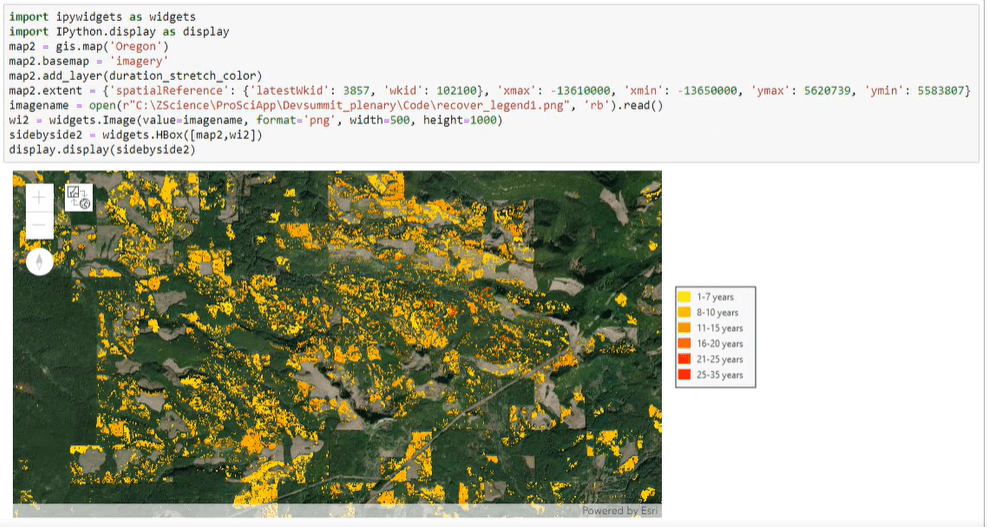
The same raster analytic function was used to generate a recovery duration map to visualize forest recovery over time. It was evident in the recovery duration map that most forest areas in the West Cascades ecoregion require, on average, over 10 years to recover.

Finally, she used the output change analysis raster generated by LandTrendr to classify the time series imagery and then visualized the result in a multidimensional raster using ArcGIS Pro’s powerful visualization tools.

Learn more
Hong Xu’s demo showed how LandTrendr can be leveraged to extract information on forest cover changes from Landsat satellite imagery. Visit the ArcGIS Pro documentation to learn more about how you can use Landtrendr to analyze land surface changes.


Commenting is not enabled for this article.