In the new Map Viewer, now available for general use, you can modify the display of your imagery layers.
Whether you are working with image services from an Enterprise deployment or with the many imagery layers available on the Living Atlas, you can now add them to a web map in the new Map Viewer and change the style of the imagery. Style is an important part of map creation, data visualization, and story telling.
Check out some examples below!
Stretch style
Applying a stretch to continuous raster or image data allows you to apply various color ramps and enhance the contrast in your imagery layer. Stretching is helpful when you want to make certain features in a continuous dataset more obvious.
See how we stretched the pixel values on this surface elevation layer in Charlotte, North Carolina so that the taller buildings are brighter than other surroundings.

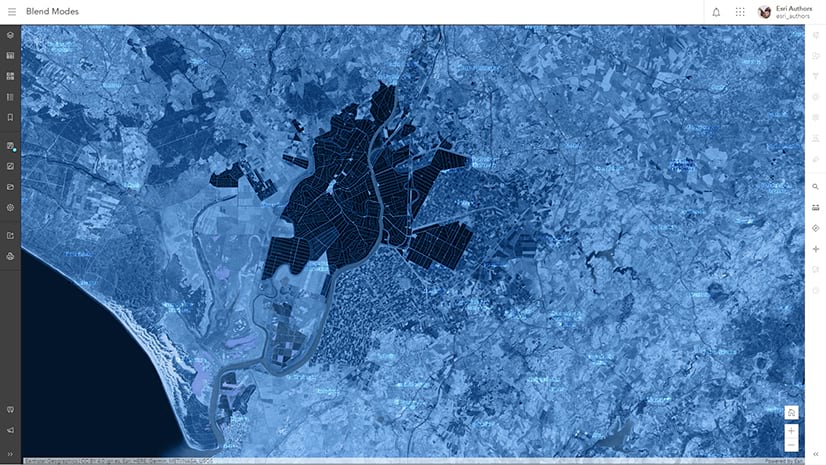
RGB style
Rendering imagery data using the red, green, and blue (RGB) color composite allows you to use information from multiple bands in your multiband imagery to highlight specific features in the imagery.
Check out this example, where the red, green, and blue channels use values from the Near Infrared, Red, and Green bands in a Landsat image, in order to highlight vegetation in this region of southwest Cameroon.

Classify style
The Classify style lets you group pixel or cell values into ranges (or classes) and display each class with a given color. This can be applied to single-band imagery layers.
Take a look at how we used the Classify style to classify temperature data into risk zones.

Unique values style
Rendering your imagery using unique values is useful for displaying thematic or categorical data, like land cover. This style can be applied to imagery layers that were published with a raster attribute table.
For example, the National Land Cover Dataset (NLCD) layer that was published with land cover categories looks great when rendered with unique values.

Shaded Relief style
Shaded relief is supported for imagery layers containing elevation data, and it’s used to represent terrain with shading. This is really useful for highlighting changes in elevation in an area.
Check out this shaded relief map of Iceland, where subtle changes in elevation can be seen easily with this renderer.

Get started
Want to try it for yourself? Check out step-by-step instructions for each style in the documentation. Then, sign into your ArcGIS Online account, browse the Living Atlas layers for some imagery data, and get started styling in the new Map Viewer!
Other options, like support for colormaps, are coming in a future release. Enjoy!


Article Discussion: