Introduction:
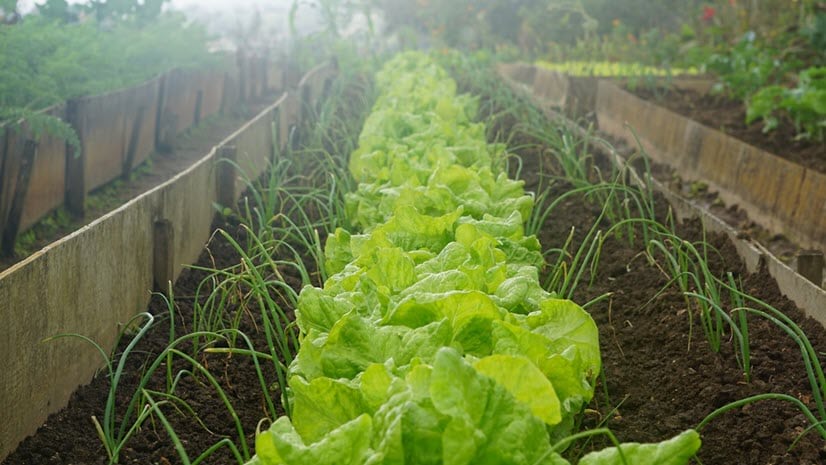
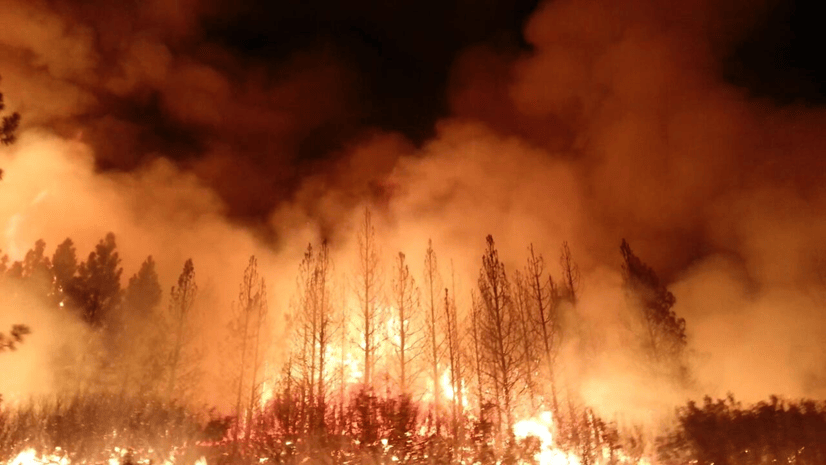
Due to a combination of record-breaking heat, severe drought conditions, and dry winds, a series of devastating wildfires impacted the West Coast of the United States during the summer of 2020, burning millions of acres of land. The wildfires resulted in loss of life and property on the ground and disruptions in the air from their associated smoke plumes. By visualizing and animating NASA Atmospheric Infrared Sounder (AIRS) data using 3D voxel layers, we can track the movement of wildfire plumes at all levels of the atmosphere. This capability enables scientists and first responders to analyze the fires from the ground, and also provides a “bird’s eye” view.
About NASA Goddard Earth Sciences Data and Information Services Center (GES DISC) and AIRS Mission:
The Atmospheric Infrared Sounder, AIRS, is an instrument onboard NASA’s Aqua satellite. This instrument collects information on the different layers of the atmosphere and provides hyperspectral imagery through applying various processing algorithms. Its data provide three-dimensional (3D) measurements of temperature and water vapor through the entire atmospheric column, along with a host of trace gas concentrations, Earth surface properties, and cloud properties. Data products from AIRS are used by weather prediction centers around the world to improve weather forecasts. AIRS data products are also used to assess the skill of climate models and have been employed in applications ranging from volcanic plume detection to drought forecasting.
The aerosol data studied in this analysis is the CO_VMR variable from the AIRS daily Level 3 collection (AIRS3STD_7.0)[1]. CO_VMR is a unitless measurement of Carbon Monoxide (CO) measured as a volume mixing ratio [2]. Level 3 datasets are processed to create a daily grid of global data. This AIRS dataset presents a volume mixing ratio representing the amount of CO molecules in each standard volume of air at a spatial resolution of 1×1 degree pixels. AIRS datasets are currently served by the NASA Goddard Earth Sciences Data and Information Services Center (GES DISC), a NASA data center which primarily focuses on atmospheric composition, water, and energy cycles, and climate variability. AIRS datasets and services are available at the GES DISC website [3].
Making the Dataset “Voxel Ready”
In order to demonstrate the extent of the smoke plume resulting from the 2020 California wildfires and its atmospheric transport, data for AIRS (Level 3) daily CO vertical mixing ratio were downloaded across 12 atmospheric levels of constant pressure for the first 20 days of September 2020 using the OPeNDAP subsetting service [4]. For this workflow, we used isobaric levels as proxies for approximate height in the atmosphere. The data is provided in a NetCDF file format with each day provided as a single file. In order to read this series of data as an animated voxel layer, it is necessary to combine these individual files across a time dimension. Using ArcGIS Notebooks, we used Python open source libraries (xarray / NetCDF4) to combine individual files into a single .nc file.

Visualizing the Voxel
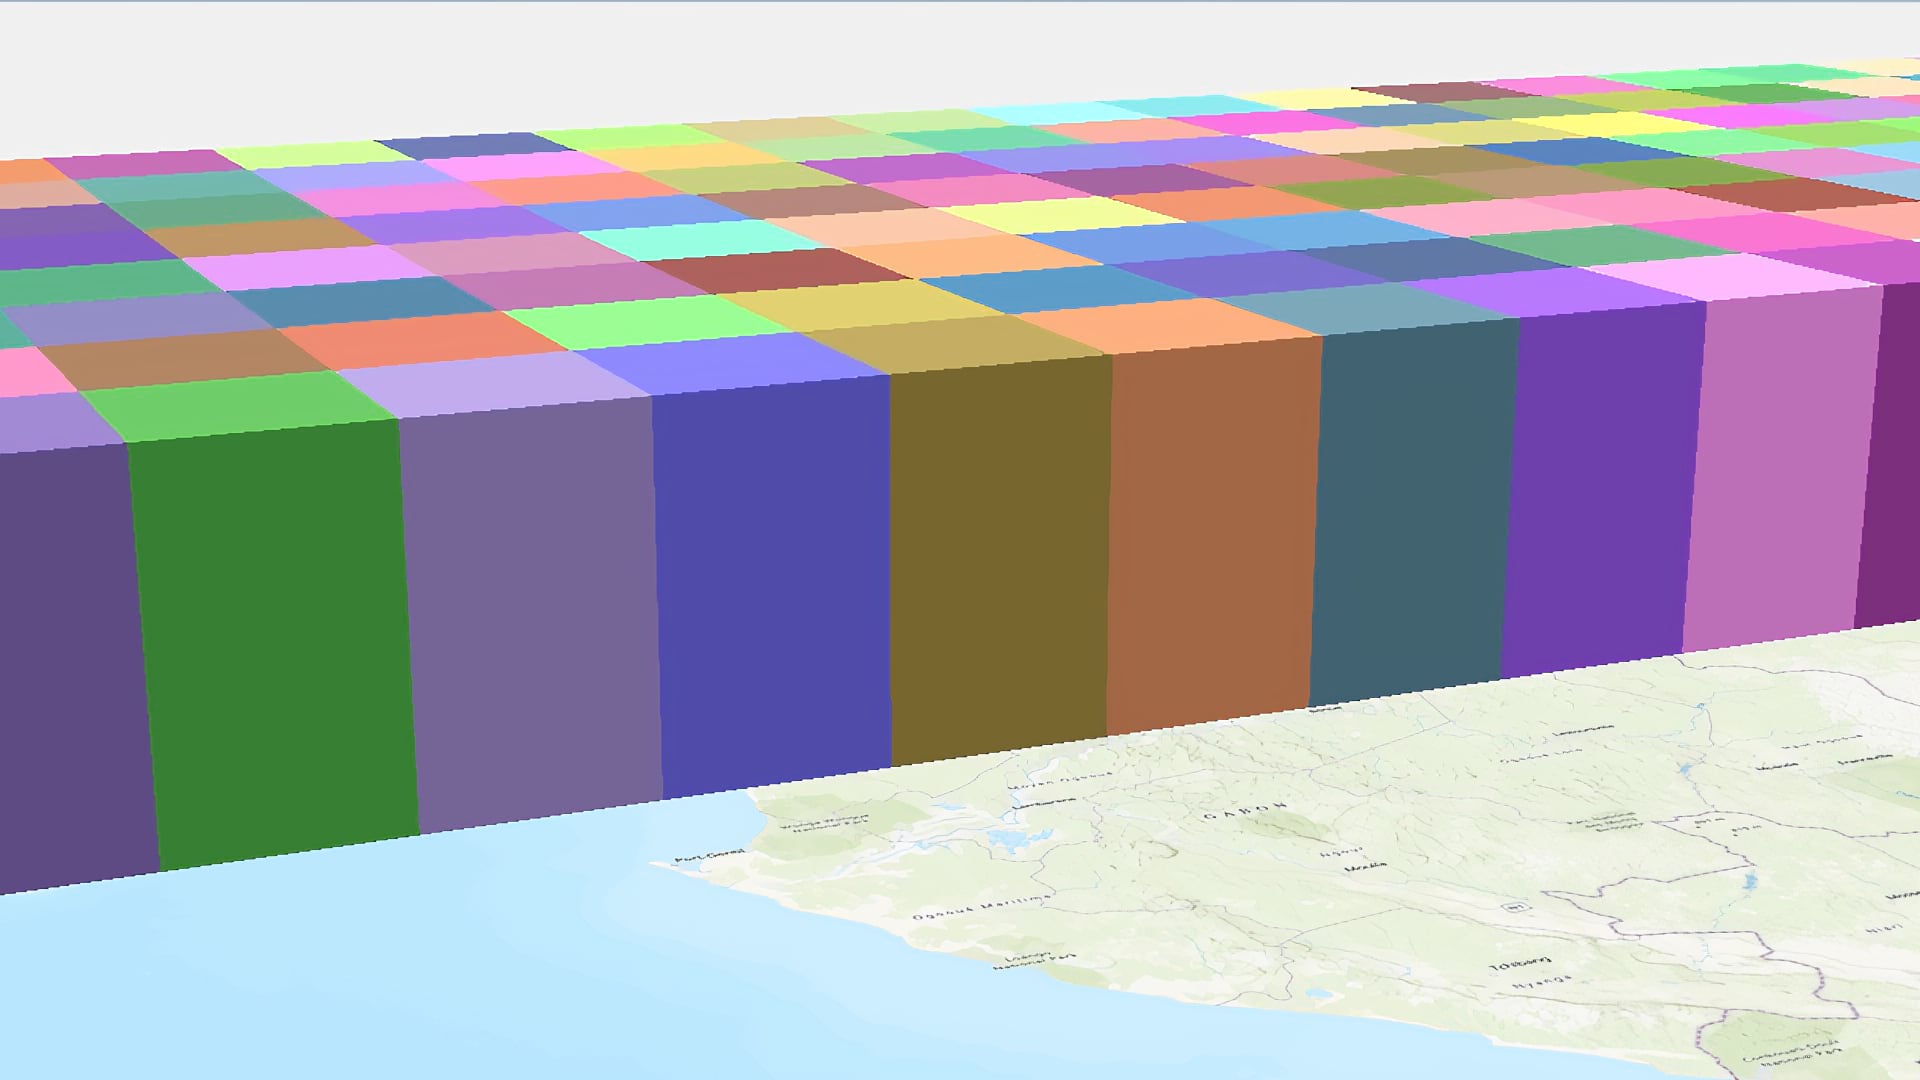
What is a Voxel?
A voxel is a 3D representation of multidimensional data. Much like a pixel is a square that holds a value in two dimensions, a voxel represents a 3D cube with values representing a lateral area (x,y) and a height (z). By opening a scene in ArcGIS Pro version 2.6+, we created a voxel layer using the ‘Add Voxel Layer Wizard’ and pointed to our time-enabled NetCDF file. Once this was created, we could then use default ArcGIS Pro 3D navigation to visualize the spatial and vertical distribution of CO in the atmosphere.

Slicing:
Slices can be created with the voxel layer in order to see cross-sections, profiles, and changes with altitude. A slice is added by right-clicking on the Volume option and selecting ‘Slice and Section’. From the menu appearing at the bottom of the screen, the direction of the slice can be chosen. Figure 3 shows a vertical slice in the AIRS CO data that displays the shape of the plume above the wildfires in California. The slice gives more insight regarding the height of the smoke plume and its distribution along the cross-section line, indicating which regions would have their air quality most affected by the smoke. In this case, the CO concentration is greatly increased over the west coast of the United States.

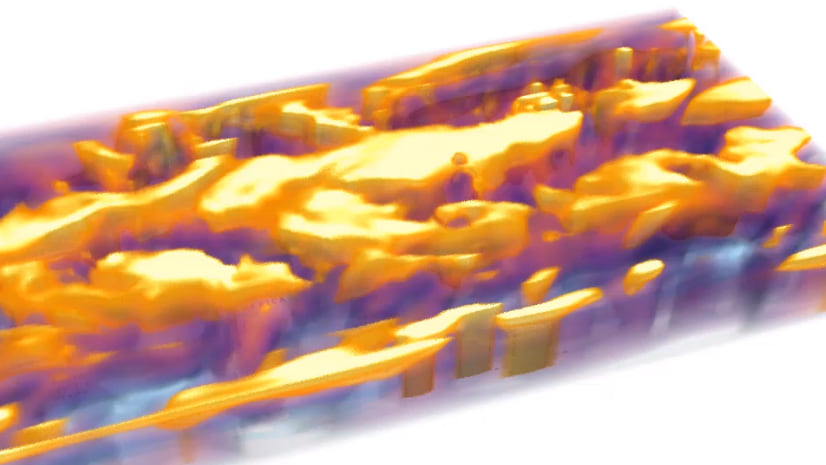
Transparency Function:
Voxel layers can be made transparent to highlight key values, as well as the layers beneath the selected voxel layer. In Figure 4, the low values of CO have been made transparent in order to highlight plumes with the highest aerosol concentration. As a result, it is possible to track the movement of plumes near the surface as lower concentration values in the upper atmosphere become transparent. The transparency function could also be used to observe multiple datasets together. For example, if the CO layer is semi-transparent, then additional contextual layers, such as wind speed and direction, could be shown in conjunction to indicate the path of movement of the smoke plume.

Isosurfaces:
An isosurface layer is a surface representing a specific value, in this case highlighting the 3D location of specific aerosol values in the atmosphere. The value of the isosurface may then be adjusted. For this study of wildfires, we can use isosurfaces to determine where the CO concentration spikes to high values over the location of the fire. Individual isosurfaces can be extracted by selecting the ‘Surface’ option, right-clicking, and selecting ‘Create Isosurface’.
Animation:
For datasets that cover multiple points in time, voxels may be animated to scroll through each point in time. Since we have time-enabled our layer, we can animate the CO plume as it interacts with various atmospheric dynamics. Figure 5 shows an animated voxel display of the CO plume from the wildfires moving toward the northeast over time, as the prevailing wind blew smoke from the fires over a large portion of the United States.

Conclusion:
The GES DISC AIRS dataset, in combination with the multidimensional voxel feature in ArcGIS Pro, is clearly a powerful tool that can be used to visualize the effects of the 2020 California wildfires by mapping CO concentrations in the smoke plume in time-enabled 3D layers. With GIS, other datasets can be added to provide additional context, including data on atmospheric composition layers or dynamic processes. Many of these datasets and variables are also provided by GES DISC. In addition, GES DISC datasets such as the Modern Era Retrospective-analysis for Research and Applications -2 (MERRA-2) and AIRS, have more variables including atmospheric water vapor, temperature, and chemical species which enable modeling of different components of atmospheric chemistry, potentially indicating hazardous haze layers or noxious components of smoke plumes. Voxels can also be used to visualize oceanic processes at different depths below the surface of the ocean or the distribution of underground geologic structures and soil moisture profiles [5]. Instead of a physical third dimension, voxels could also be used to display data with a temporal third dimension, with changes through time shown at each point. More analytical capabilities will be added to the multidimensional voxel tool with future ArcGIS Pro updates.
About the Authors:
Allison Alcott
Allison Alcott is a Scientific Programmer at NASA Goddard Earth Sciences Data and Information Services Center (GES DISC) where she is working to expand GIS services and content. She has a background in geology and remote sensing.
Jennifer Wei
Dr. Jennifer Wei is the lead scientist at the NASA Goddard Earth Science (GES) Data and Information Services Center (DISC), who guides the science support staff (1) to promote DISC data and services awareness to the science teams and user community, (2) to advocate the user needs from research and application communities, and (3) to broaden user community by participating science team meetings, user/application workshops, conferences, and forums
Binita KC
Dr. Binita KC is a data scientist and user needs lead at NASA GES DISC. She is an expert in geospatial data analysis and her research background is in extreme weather and climate risks, social vulnerabilities, urban heat island, and urban typology.
Lu Zhang
Lu Zhang is a former Esri Solution Engineer on the National Government Sciences Team in the Geospatial Center in Vienna, Virginia. Lu primarily supported NOAA and NASA as well as other federal science and civilian agencies in the adoption and optimization of the ArcGIS system. Lu has a background in atmospheric and spatial data science.


Article Discussion: