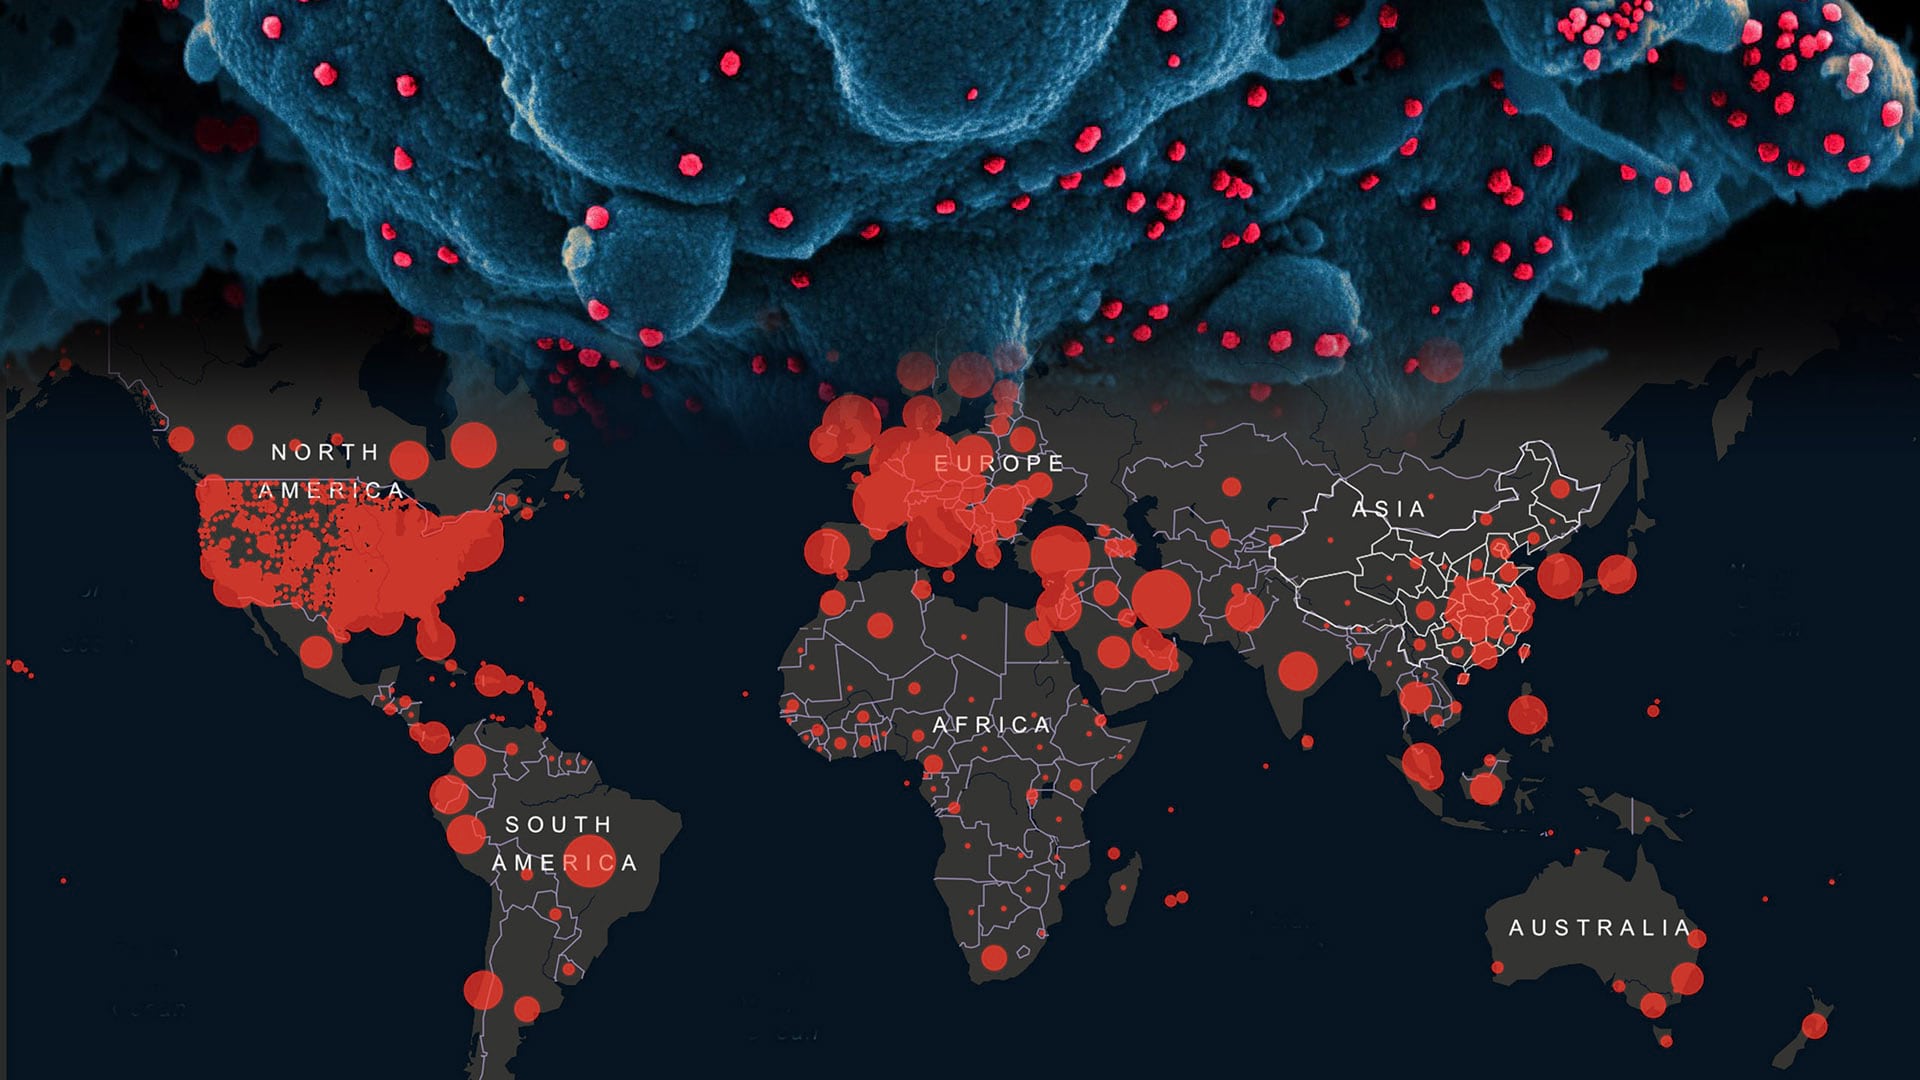
As we enter the second year of the coronavirus (COVID-19) pandemic, vaccine supply and vaccination rates are increasing throughout the world. Vaccinating the world’s population is an enormous undertaking and understanding where vaccine availability, accessibility, and hesitancy may be impacting vaccination rates is critical.
The Vaccine Coverage Analysis delivers a set of capabilities that help health and human services agencies identify priority and underserved populations, locate optimal vaccination sites, and share vaccine coverage gaps with internal and external stakeholders.
Map vaccination rates and identify priority populations
Health and human services agencies at every level of government want to understand where vaccination rates may be high or low and adjust vaccination campaigns as appropriate. Vaccine Coverage Analysis helps health officials load vaccination data, aggregate it into geographic regions, and calculate a vaccination rate for each given geography.
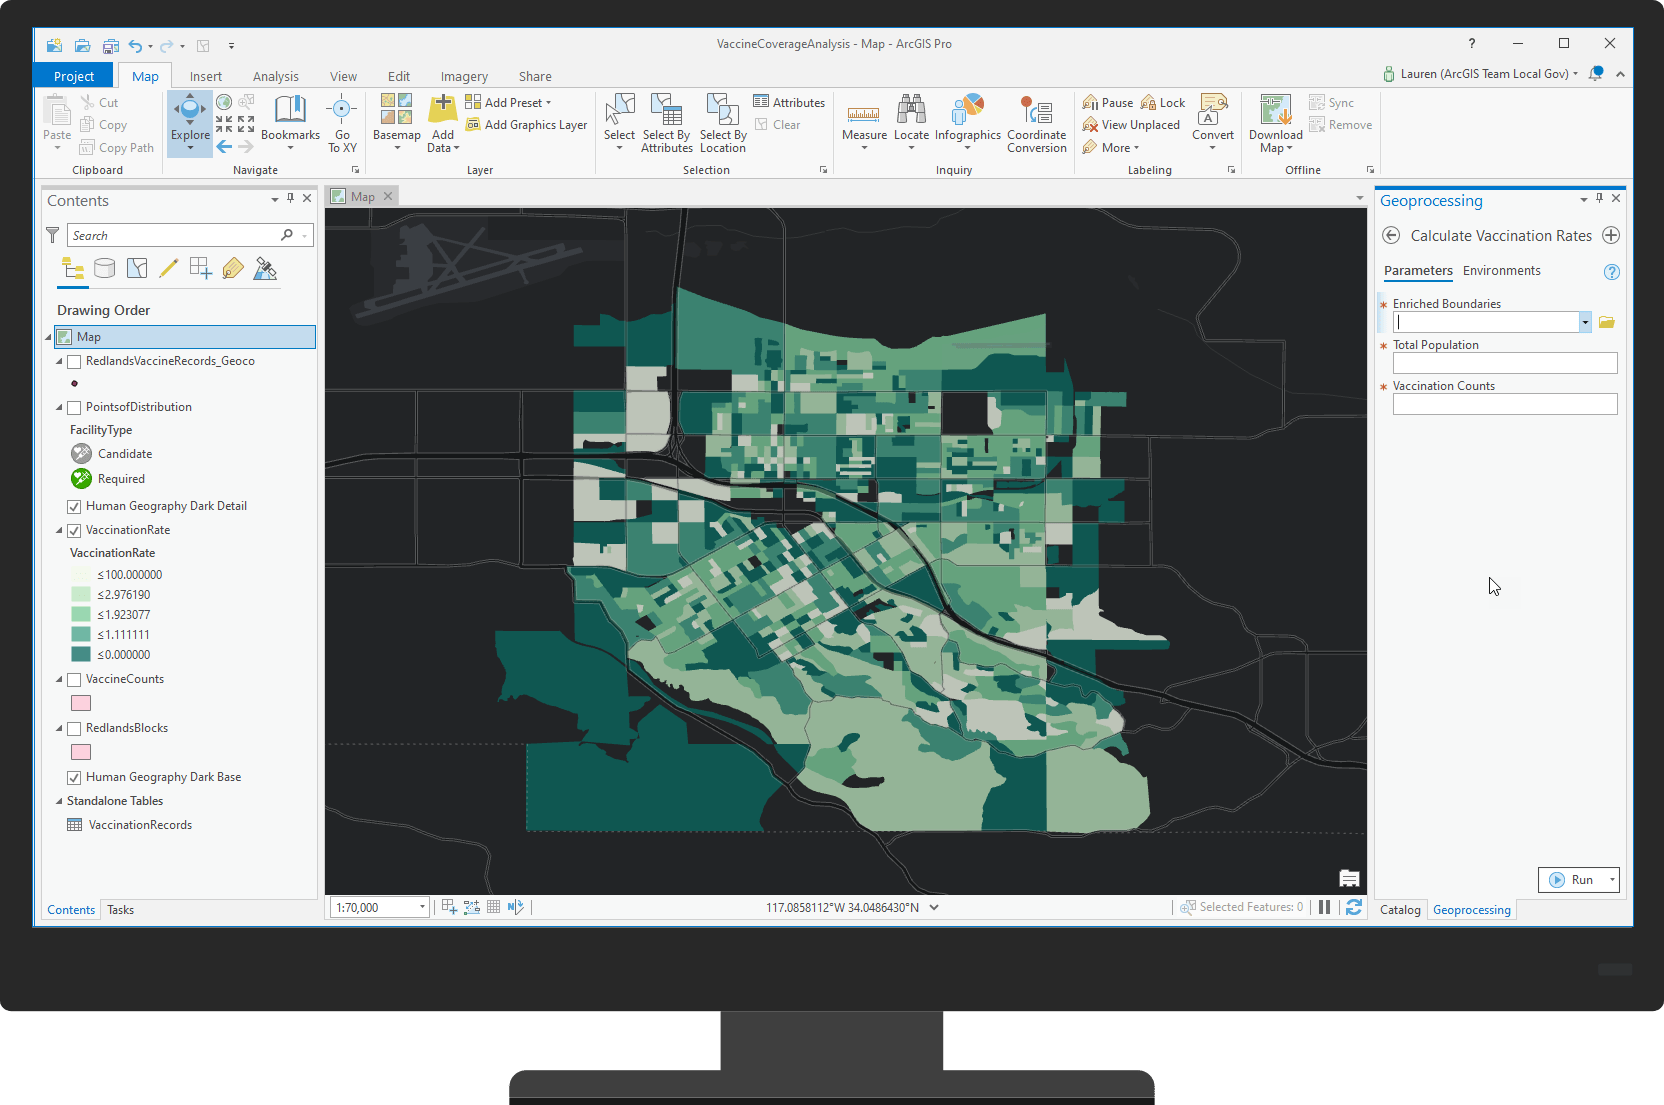
Personally identifiable information is removed in this process, but any demographic data collected with vaccination records (such as race, age, ethnicity, etc) can be used to focus in on vaccination rates of specific populations. The resulting map allows health and human services agencies to quickly see where vaccination rates are low.
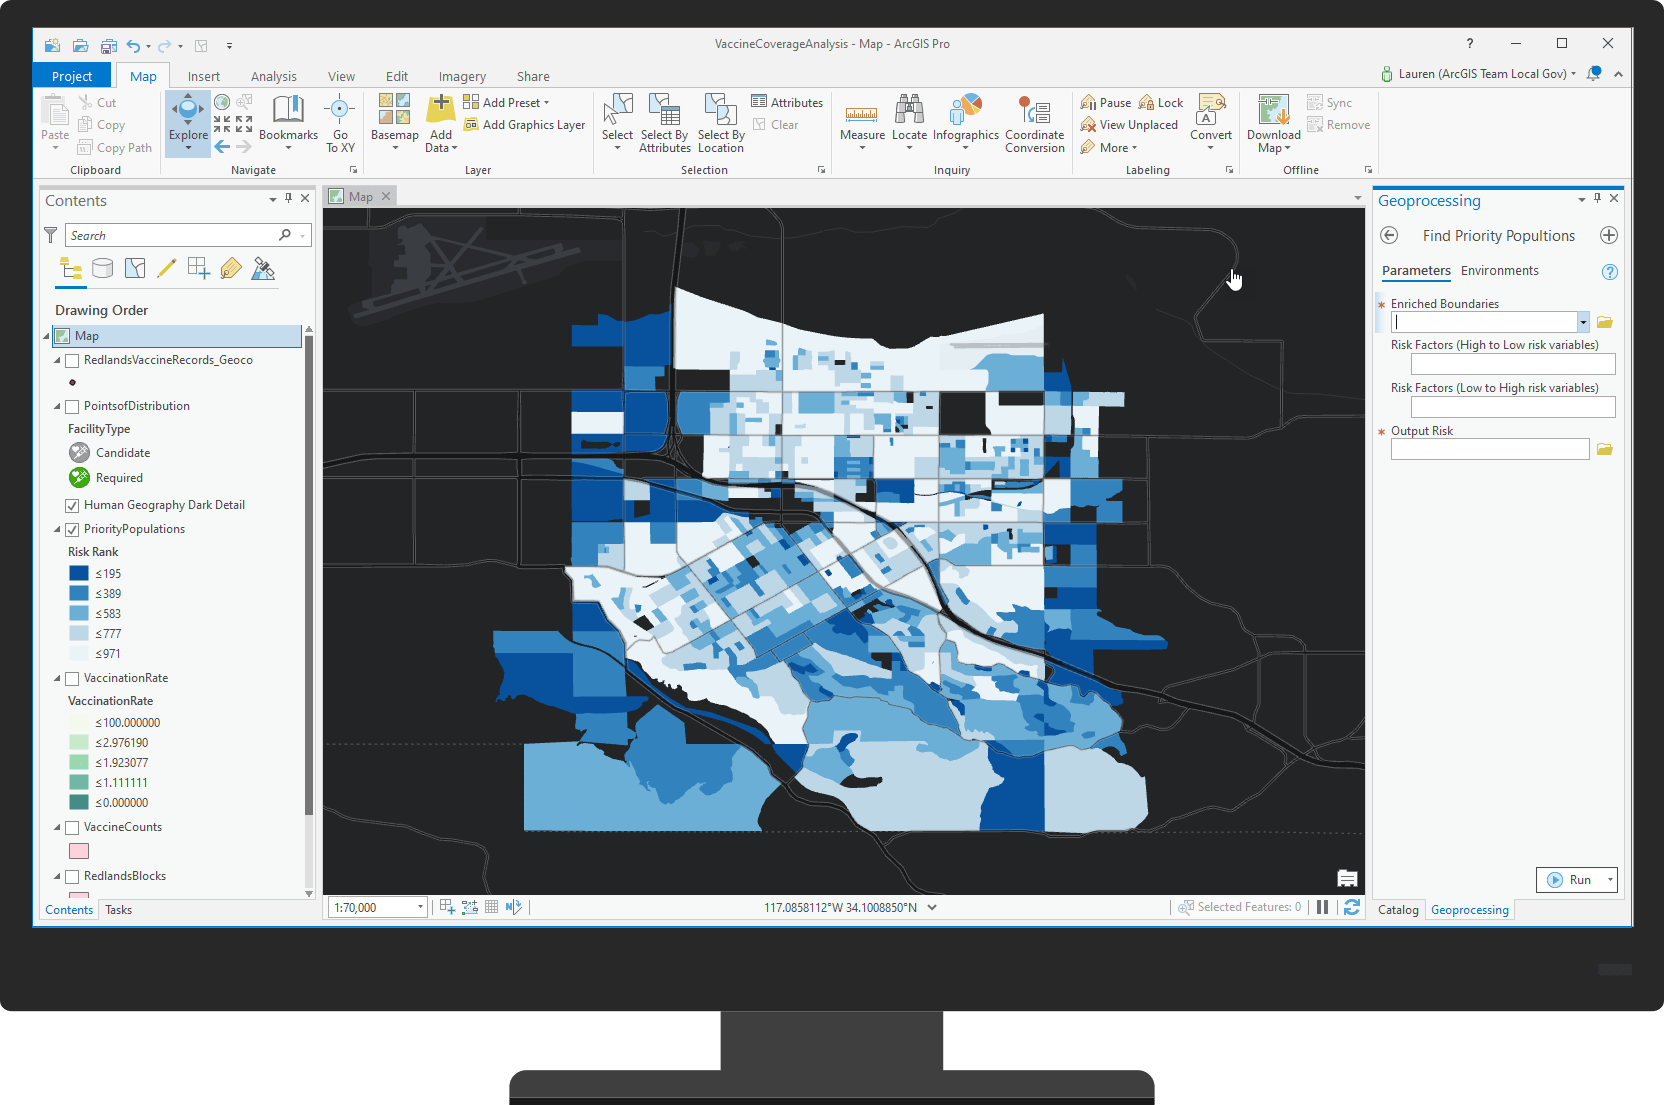
Health and human services agencies also need to know where concentrations of priority populations are located. The solution is configured to identify populations at greatest risk to COVID-19, but can be adjusted to focus on any priority population to ensure that vaccine distribution is equitable. The resulting map helps health and human services agencies see where the highest concentrations of priority populations are located and focus their outreach and vaccination efforts where they are needed most.
Find underserved populations
The term “underserved populations” refers to areas where low vaccination rates coincide with high concentrations of priority populations. These areas are a high priority for health and human services agencies.
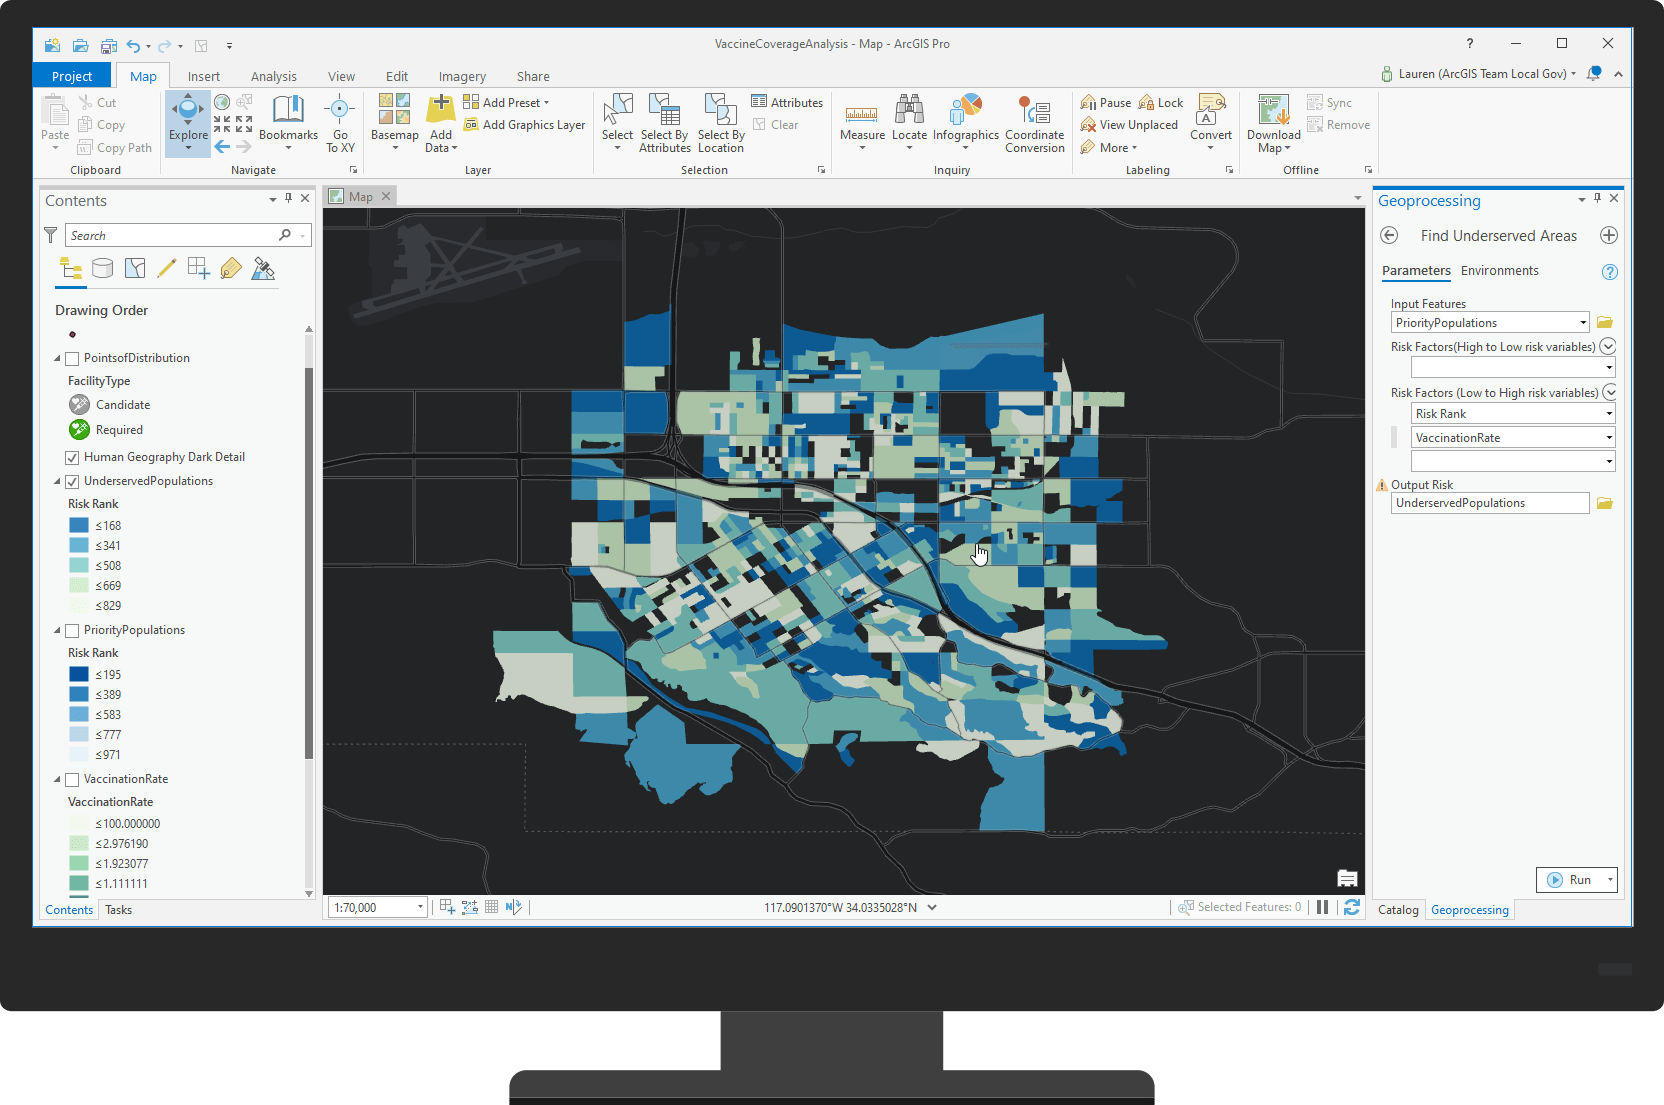
The Vaccine Coverage Analysis solution combines these two key pieces of information to create an index ranking of the underserved-ness for each region. The resulting map can be used to identify where vaccination sites are needed most.
Evaluate coverage with travel time
Health and human services agencies can also gain valuable insight from knowing how existing vaccination sites are serving populations. The solution determines how many people are within a specified travel time of existing vaccination sites.
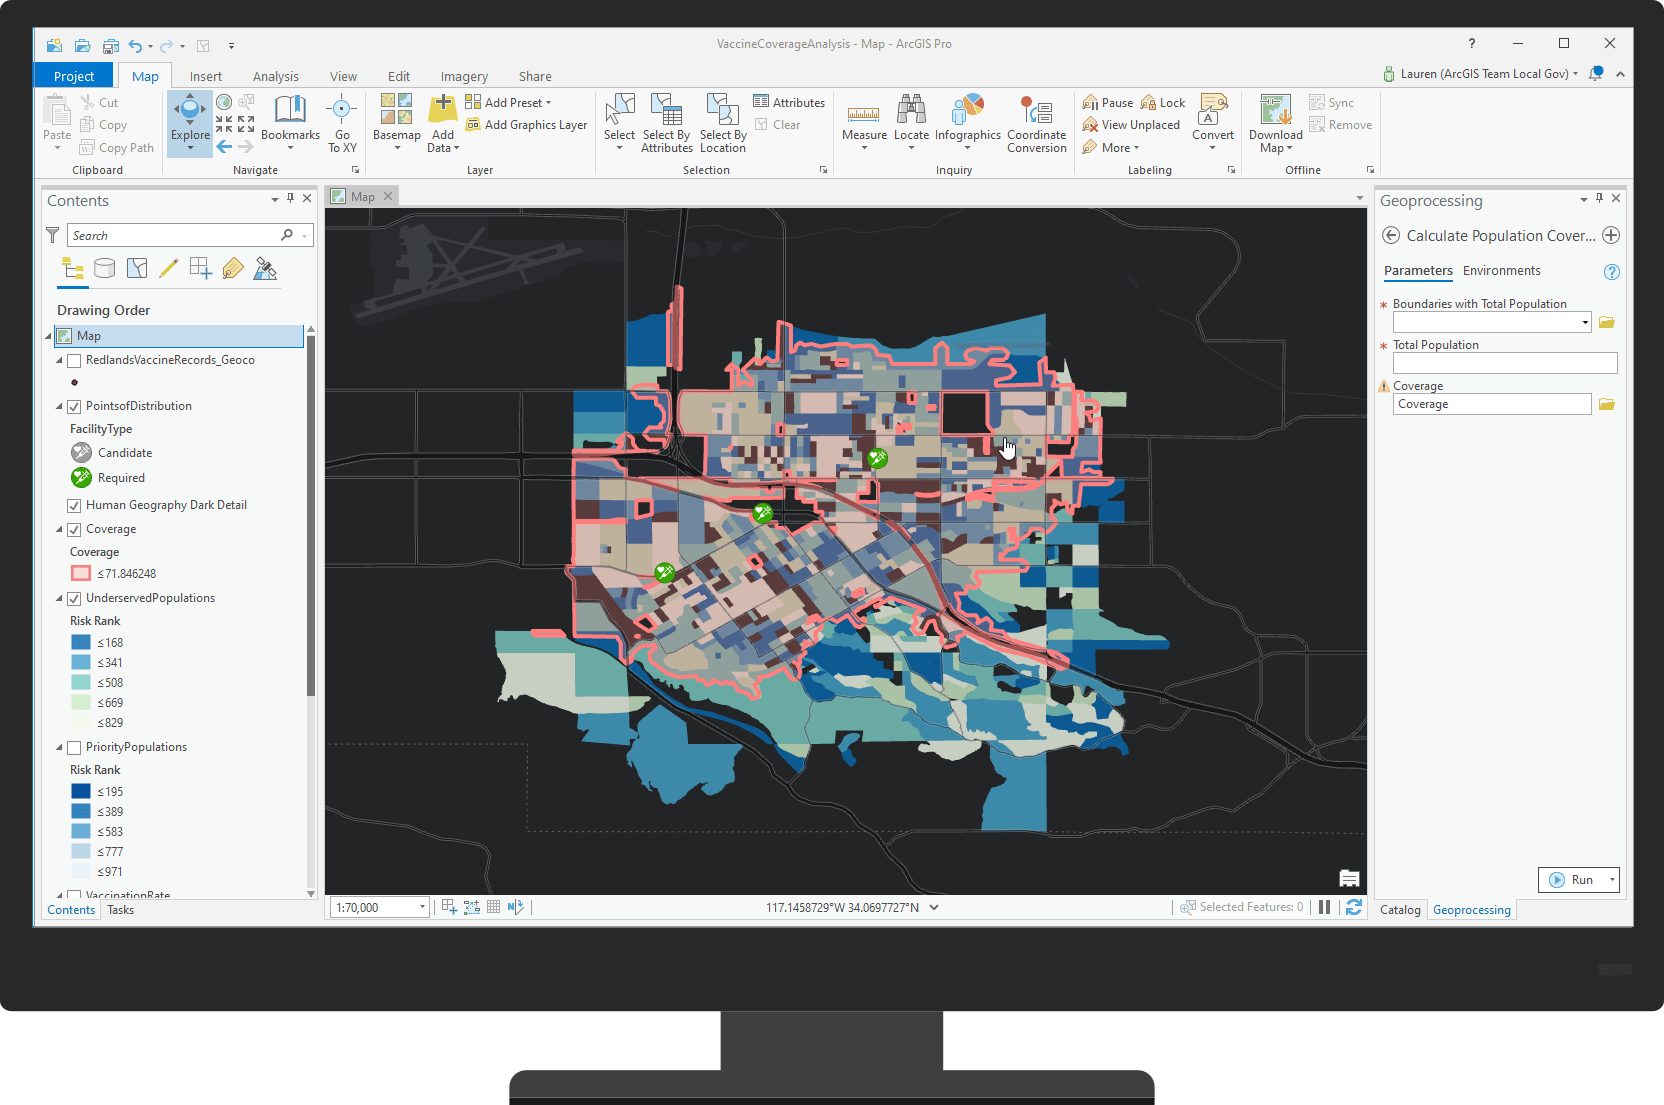
Travel modes and times can be adjusted to reflect local conditions, if necessary, and ultimately used to visually evaluate whether or not underserved populations are within a given travel time.
Select new distribution sites
If existing vaccination sites are not reaching underserved populations, the Vaccine Coverage Analysis solution can be used to select the best new distribution sites from a set of candidate sites you provide.
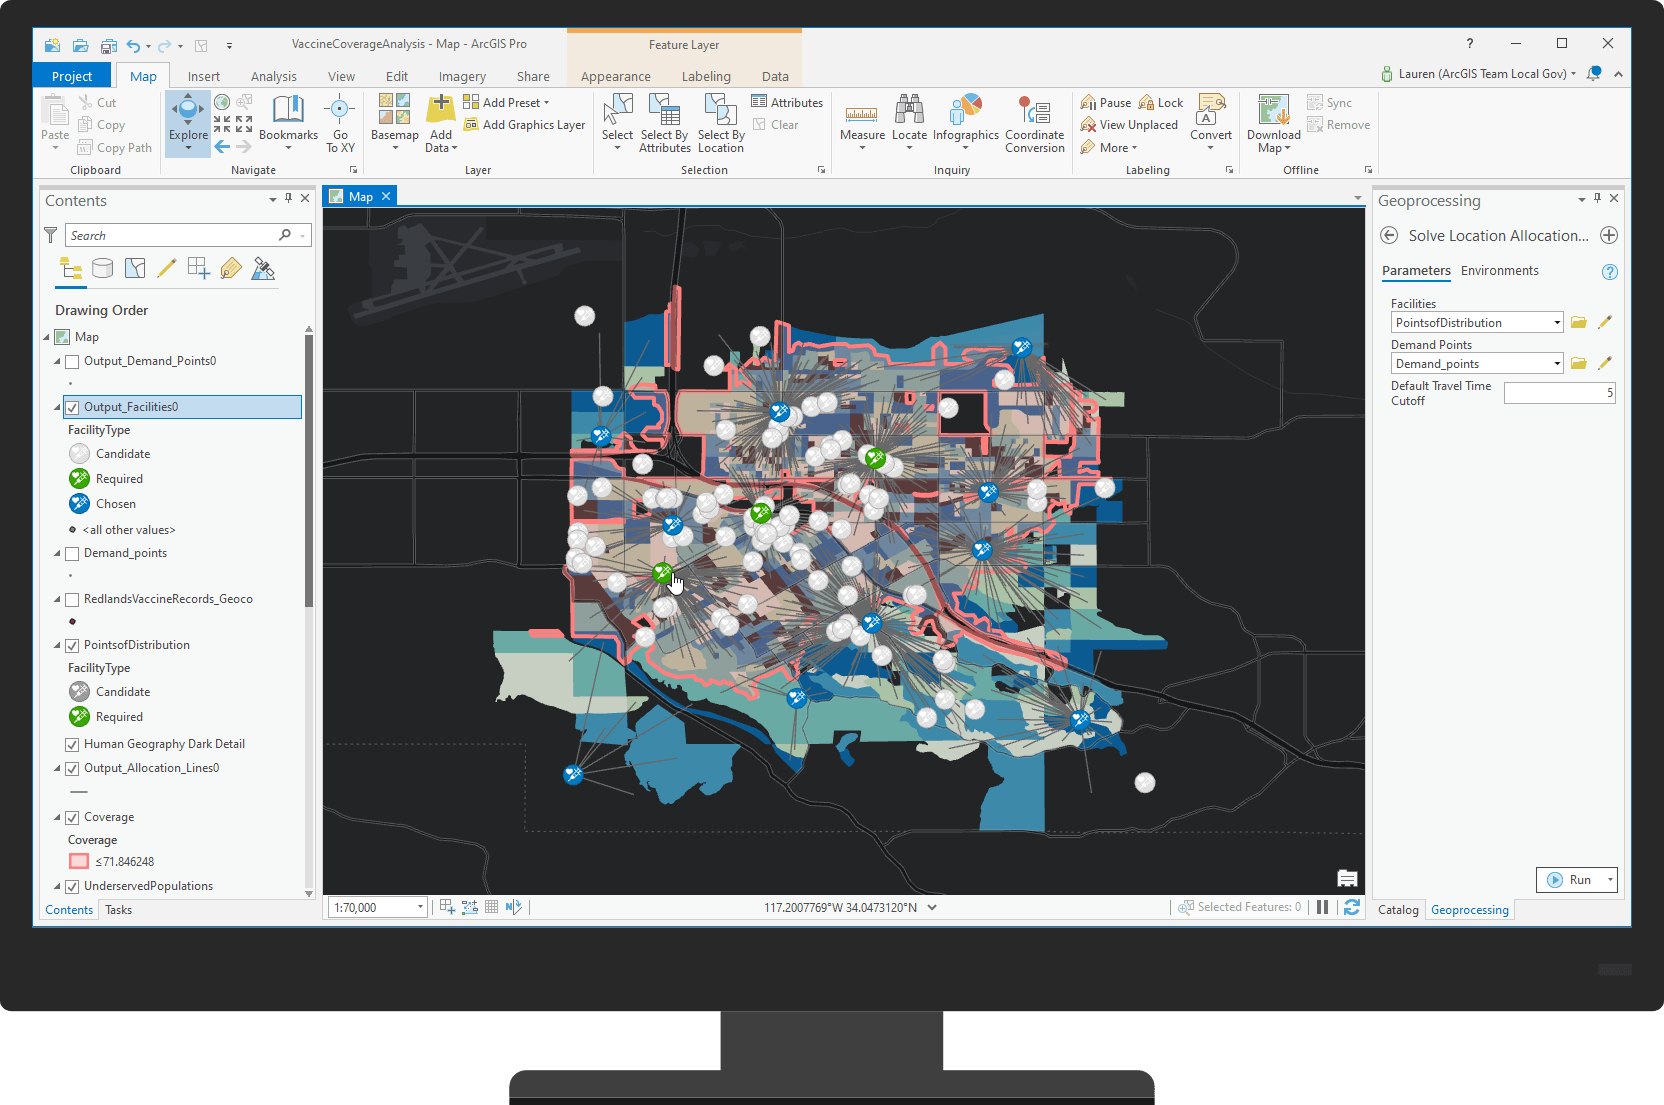
The selection process weights each region as a point of need, so that regions that are highly underserved have a site that is closer to them. This ensures that new sites will be selected in areas that are in need of them.
Additional resources
Learn more about COVID-19 vaccine distribution solutions and how you can quickly deploy these solutions on the ArcGIS Solutions site. For question and feedback, chat with us on GeoNet or contact Esri Support Services.
Finally, Esri is providing several resources to help organizations address COVID-19. The COVID-19 Hub is the place to access additional resources and to request GIS assistance from Esri.
Article Discussion: