To effectively reduce crime, modern police agencies use maps and data to understand where incidents concentrate and make daily operational decisions. This concept, called place-based policing, has been rigorously evaluated, and operational responses that focus on crime hot spots have consistently been proven to be effective at reducing crime.
Many agencies attempt to reduce crime by using place-based policing, but they struggle because inefficient data processes and static analysis products impede their ability to efficiently detect and respond to hot spots.
The Daily Activity Dashboard solution delivers a set of capabilities that help law enforcement agencies manage crime and calls for service data, monitor daily activity, and identify current incident hot spots.
Previous releases of the solution included a single dashboard containing both crimes and calls for service data. To offer users greater flexibility and improve performance, the latest release of Daily Activity Dashboard now includes separate dashboards for crime and calls for service.
Monitor daily crime activity and accelerate hot spot analysis
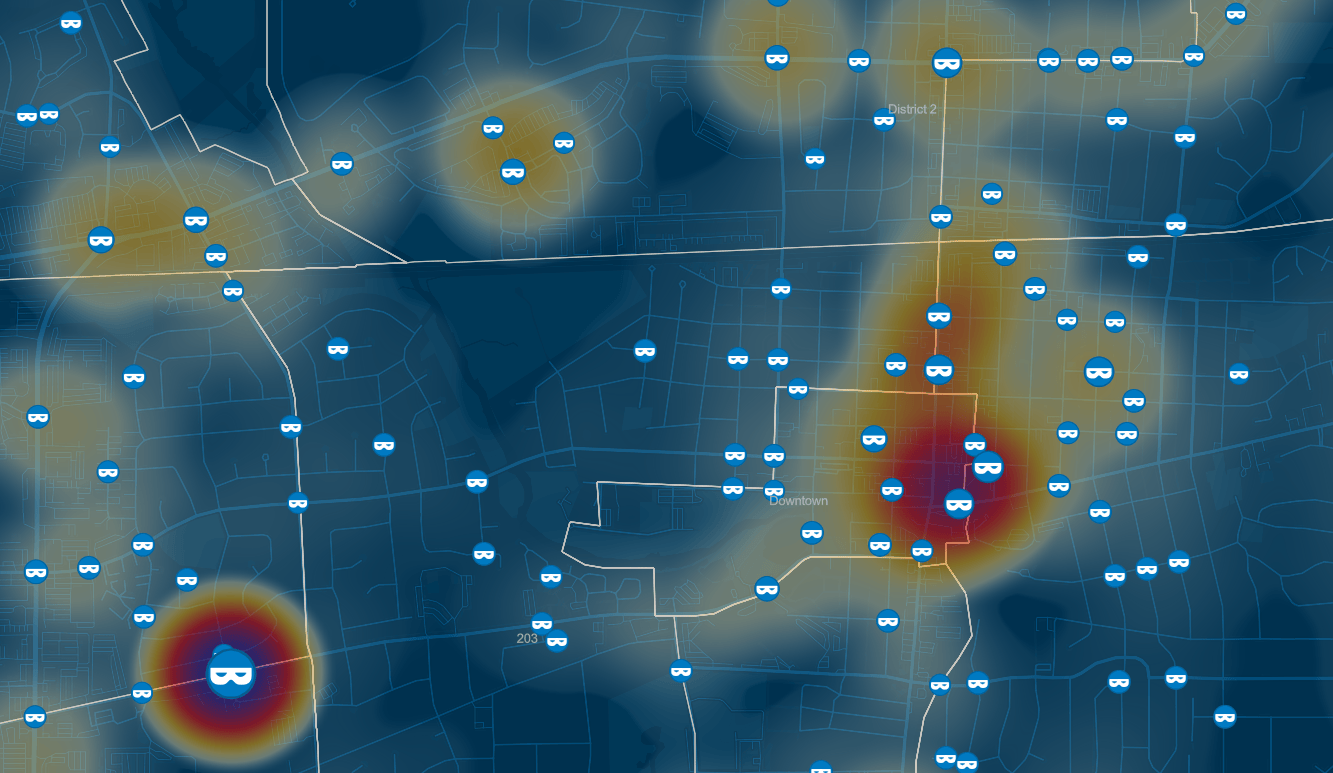
Daily Crimes Dashboard is used by police personnel to understand recent trends and visualize current hot spots in crime, which helps personnel effectively allocate operational resources.
To help you understand where crime is occurring, the dashboard displays hot spots and point locations of crime overall. It also displays a series of charts that allow you to explore crime by day, hour, and day of week. Charts of crime by type, weapon, location, and case status add context to current crime conditions. Selecting a crime from the list displays details of the selected incident.
By default, the dashboard displays the last seven days of activity, but you can filter for any timeframe of interest. If you want to understand conditions for a particular area, filter by beat or district. The map adjusts to display crimes and hotspots specific to the selected area, and additional filters can be applied to explore patterns by NIBRS crime type or category.
If you observe a hot spot of interest, you can use the lasso tool to select all crimes within the hot spot and have the list and all charts filter to display information for that selected hot spot. This action helps you understand characteristics of the incidents in the hot spot and plan response for when the hot spot is most active. If you need a printed list of crimes, you can download a csv for printing and sharing.

Monitor daily activity and accelerate analysis of calls for service hot spots
Daily Calls Dashboard is used by police personnel to understand recent trends and visualize current hot spots in calls for service, which helps personnel effectively allocate operational resources.
Like the Daily Crimes Dashboard, the Daily Calls Dashboard displays hot spots and point locations of calls for service. You can use a series of charts to explore calls for service by day, hour, and day of week as well as call source, priority, disposition, and type. A chart displaying the top 10 repeat call locations helps you identify and plan responses to problem locations. When you select a call from the list, details of the selected incident display.
By default, the dashboard displays the last seven days of activity, but you can filter for any timeframe of interest. To understand conditions for a particular area, you can filter by beat or district, and the map adjusts to display calls and hot spots specific to the selected area. You can apply additional filters to explore patterns by call source, priority, type, or first unit responding.

As with Daily Crimes Dashboard, Daily Calls Dashboard enables you to use the lasso tool to select all calls within a hot spot of interest. Lists and charts filter accordingly, and you can better plan response for when that hot spot is most active. You can download a list of calls as a CSV file, which you can then print or share as needed.
Streamline mapping of crime and calls for service data
The Daily Activity Dashboard solution also includes the Law Enforcement Data Management ArcGIS Pro project. It can be used by crime analysts to automate data imports from records management or computer-aided dispatch systems.
The ArcGIS Pro project includes guided task workflows to help you load administrative areas, connect to your source crime and call databases, and publish crimes and calls for service data.
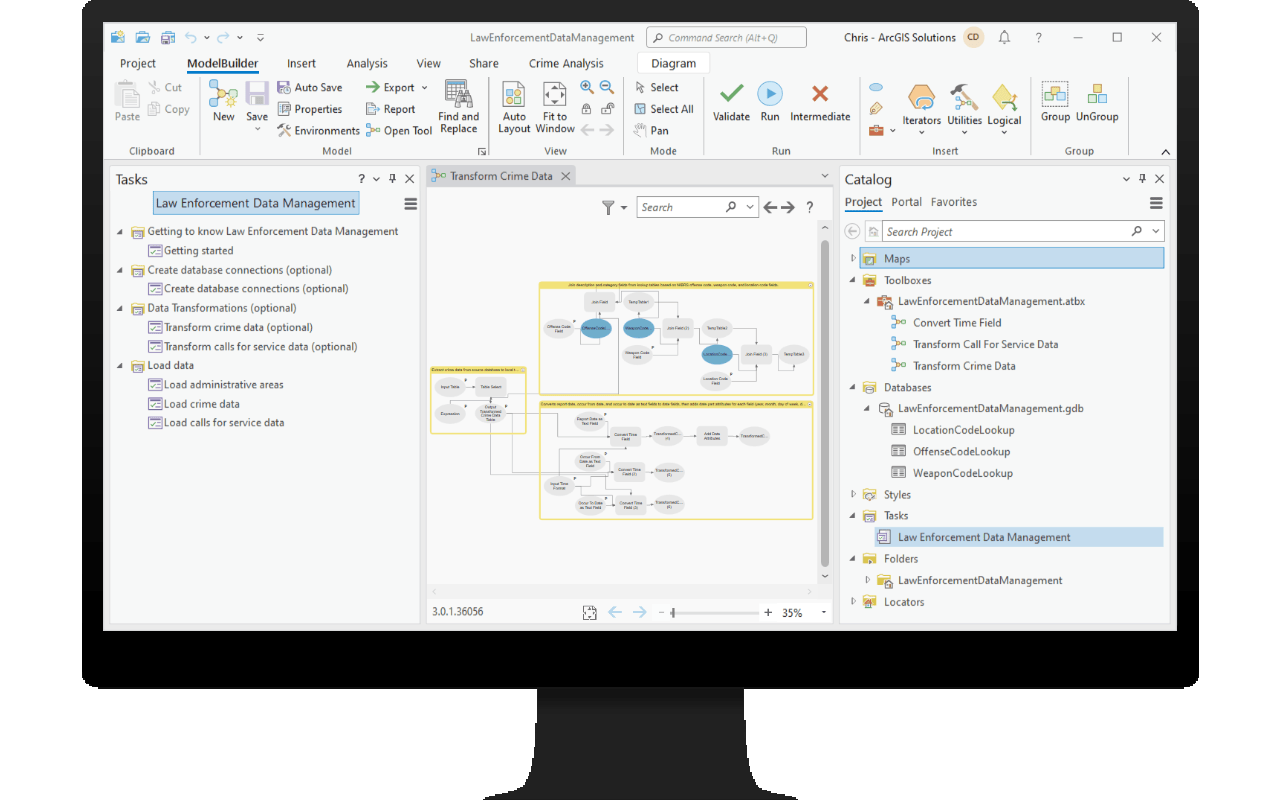
The project also provides optional tools to perform standard data transformations (adding standard NIBRS fields for offense, weapon, and location categories, as well as transforming date fields in text form) to make your data more useful. You can use ArcGIS Pro and Windows Task Scheduler to schedule tools to run automatically. These tools help remove the burden of daily manual data processing so dashboards remain fresh and staff can get right to work on their primary duties.
Daily Activity Dashboard is part of a collection of solutions for Law Enforcement, including Crime Reduction Statistics, Crime Analysis, and Police Transparency, that support crime reduction operations. Each of these solutions leverage common crimes and calls for service layers. For example, when you implement automated crime data loading for the Daily Activity Dashboard solution, subsequent solutions you deploy will leverage your existing Crimes layer in their maps and apps with no additional configuration required.
Learn more
For more information about the Daily Activity Dashboard solution, check out the following resources:
- Learn how to deploy, configure, and use the solution.
- View a demo video.
- Learn more about ArcGIS Solutions.


Article Discussion: