Many organizations have a need for real-time monitoring of employee locations for various reasons such as proof-of-work, employee health and safety, efficient workforce management, and more. ArcGIS Field Maps is a lightweight and simple-to-use mobile application that enables employees to take maps into the field, collect data, and report their location back to the office. Using ArcGIS Field Maps, organizations can know the real-time location of field personnel and use that location data for analysis.
ArcGIS Velocity is a real-time and big data analysis capability of ArcGIS Online that can process, analyze, and visualize location tracking data to yield valuable insights. By combining ArcGIS Velocity and the location tracking capabilities of ArcGIS Field Maps, you can
- determine a person’s current location using geofences,
- disseminate notifications based on events such as employees arriving at destinations,
- calculate the percentage of time spent traveling between work sites,
- verify when, where, and by whom work was done,
- alert based on criteria such as speeding or proximity to areas of interest,
- and much more.
In this blog, we will look at how to detect when somebody enters a geofence, store the event data in a feature service that can be viewed in a dashboard, and send an email notification with details about the event. This blog assumes some experience using ArcGIS Velocity. For an in-depth introduction, please refer to this documentation: get started with ArcGIS Velocity. It also assumes that you have configured location tracking already, which you can find more details on here: enable location tracking and track mobile workers.
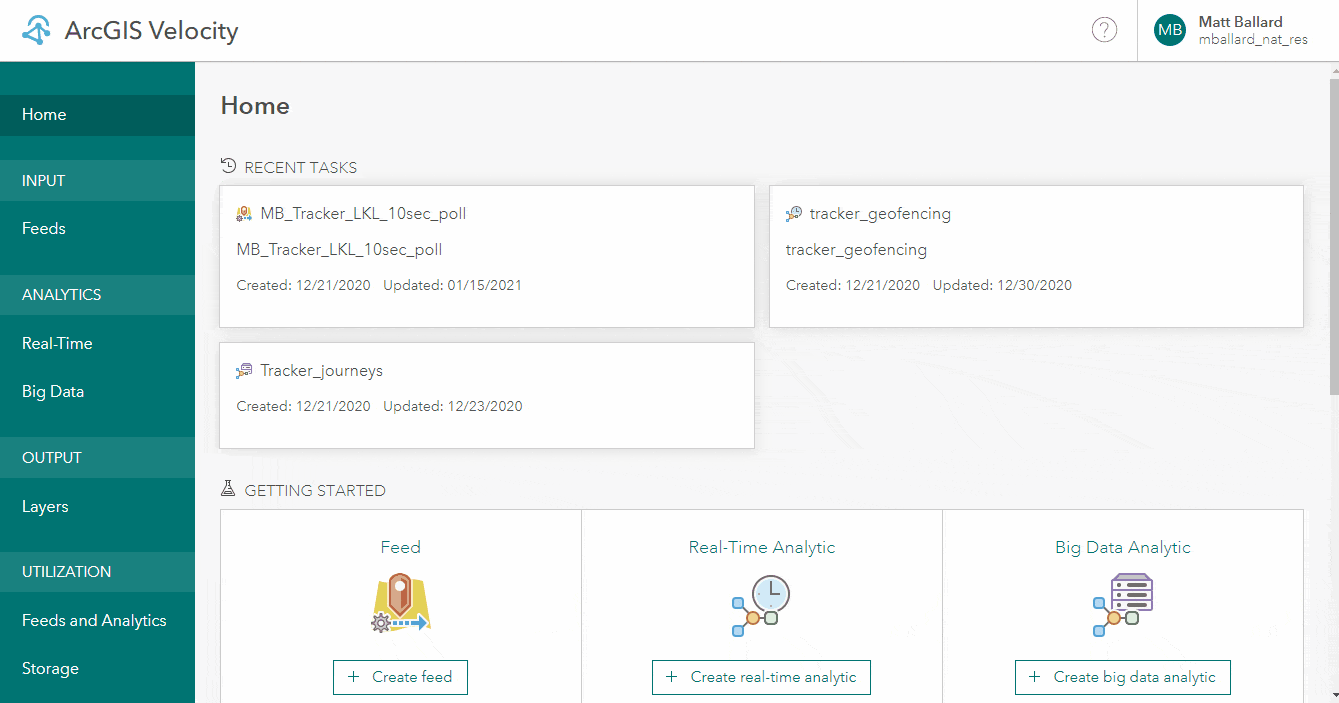
Create a feed from location tracking data
The first step is in this workflow is to create a feed that will ingest data from ArcGIS Field Maps into ArcGIS Velocity. ArcGIS Field Maps stores location tracking data in a feature service with two layers. One layer stores the last known location (LKL) and one stores the historical location tracks. For this analysis, we will configure a feed to poll the LKL layer every 10 seconds.
- In ArcGIS Velocity, begin by creating a new feed from an ArcGIS feature layer. Choose the track view that you have previously created and make sure to select the “Last Known Locations” sublayer.
- Optionally, you can filter the data using a WHERE clause (e.g. “horizontal_accuracy < 20”) or remove unnecessary fields before confirming your schema.
- Choose the “location_timestamp” field as the date field for the latest features. This timestamp field will be used each time the feed polls to only load features with a timestamp field value between the last polling time and the current polling time.
- Now, we need to identify a few key properties such as the location, time, and track ID.

5. Lastly, we’ll set the polling interval to be every 10 seconds. This is how often ArcGIS Velocity will query the location tracking feature layer.
Now your feed is complete! Just give it a name, such as “LKL 10sec poll”, and save it.
Detect when somebody enters a geofence
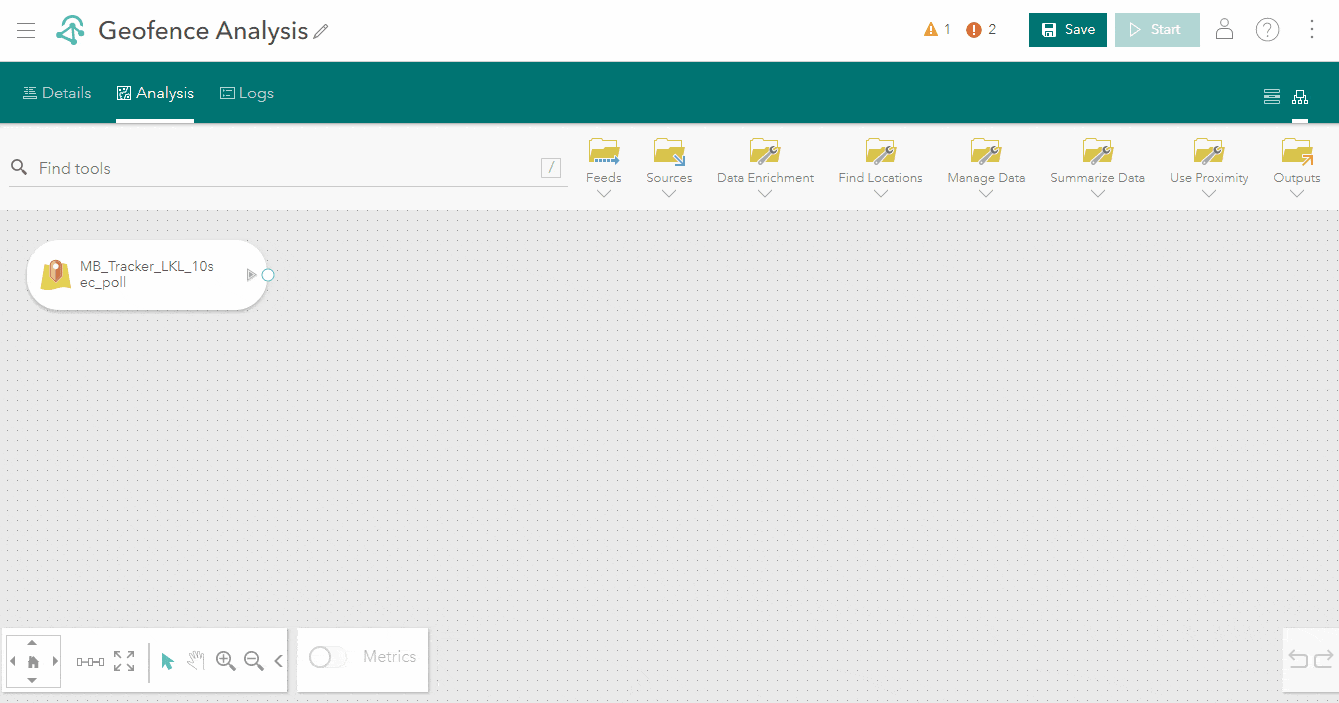
With the feed created, the next step is to create a real-time analytic to detect when somebody enters a geofence. Real-time analytics process each and every event in a feed as they are streamed into ArcGIS Velocity.
You can create a new real-time analytic from the ArcGIS Velocity homepage and use the feed that you’ve just created. Then, select “create the analytic” in the top right which will save the item and allow you to switch to the model view (see below).
Add a geofence layer
In addition to the location tracks feed, we also need to add another layer for the geofences.
- Add a new feature layer as a source to the analysis using the “Sources” menu in the top right. This layer can be any polygon feature layer that you have access to. Make sure to select a sublayer if there are multiple.
- On the “Filter Data” section, deselect some of the reserved fields that are unsupported such as OBJECTID, GlobalID, Shape__Area, and Shape__Length. Then confirm that your schema is good and continue.
- For the Track ID, select “Data does not have a Track ID” and complete your configuration.
Detect incidents
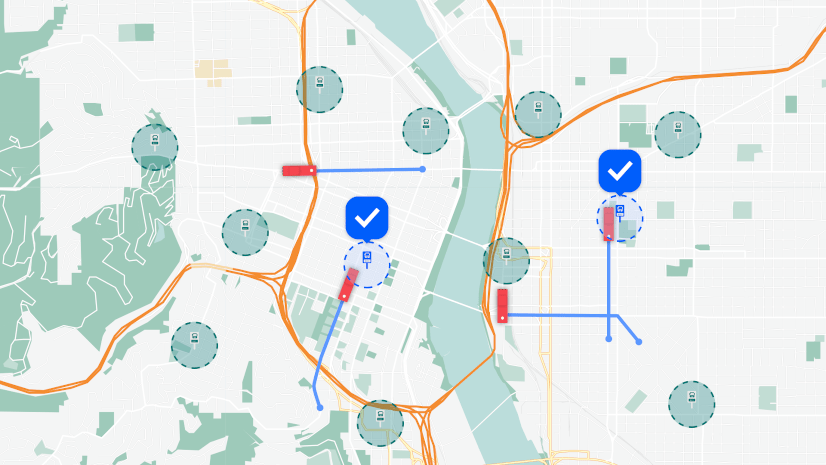
The tool that we will use for this analysis is Detect Incidents. Detect Incidents will detect when a track enters a geofence. It will also continue to detect when a track is inside of a geofence and when it leaves the geofence. The output of this analysis will have an “IncidentStatus” attribute which will either be “Started”, “Active”, or “Ended” depending on whether the track has entered, stayed inside, or exited the geofence, respectively.

On the tool menu, expand “Find Locations” and add the “Detect Incidents” tool to the canvas. Connect the two inputs and then double click the tool to open the tool settings. Configure the tool to create an incident when a user’s LKL intersects with the geofence layer.

Output your location tracks and detected incidents to a feature layer
After the analysis, we can store the outputs into a feature layer. This will allow you to use the data in web maps or applications, such as an ArcGIS Dashboard.
From the outputs menu, select a new feature layer and configure the options for data storage and retention. Make sure to choose “add new features” for the data storage method. For more specifics on what each parameter does, please refer to the documentation: Output Types – Feature Layer (new).
Give your layer a name and connect the output node of “Detect Incidents” to the input node of this output feature layer.

Send out email notifications
Now that you’ve configured all of the inputs and performed some analysis, the next step is to disseminate this data and notify people. You can view the feature layer you just made in a map or application, but sometimes it is necessary to send more immediate notifications, such as email or text messages.
Here, we’ll look at how to send an email each time somebody enters a geofence.
Filter your data
First, we need to filter the incidents to only alert us when an incident starts. We can use the Filter by Expression tool to filter where the “IncidentStatus” field is equal to “Started”.

Add the geofence name to your location tracks
In the notification, we also need to include the name of the geofence that the person entered. We can add the geofence name to our stream data using the Join tool.
In the Join tool, use a one-to-one relationship and choose “intersect” as the spatial relationship. Add a summary attribute of type “Any” and call it “GeofenceName”.
When you perform a one-to-one join, the “Any” statistic type will return the string value of the joined feature if the summary field type is a string.

Calculate an email subject
Next, you can construct an email message body by using the Calculate Field tool to create and calculate a new string field.
Add a “Calculate Field” tool from the Manage Data folder and connect the output node of the “Join Features” tool to the “Calculate Field” tool. Open the tool settings and choose to create a new string field and name it “NotificationMessage”.
Click the green pencil to edit the arcade expression and write an expression that creates a string for the message body (How to use Arcade expressions). Below is an example expression that concatenates several fields into one sentence to say which user entered which geofence at what time.
Concatenate([$feature[“created_user”], “has entered the geofence number”, $feature.GeofenceName, “at”, $feature[“location_timestamp”]], ‘ ‘)

Send the real-time email notification
Now we’re ready to send out the notifications using the email output. Add the email output from the outputs folder and it will appear on your canvas. Connect the “Calculate Field” tool output node to the “Text Message” node that was added.
Open the tool parameters and configure your email settings, including the SMTP server and username/password.

Lastly, you can configure the fields for your email. Specify the from and to email addresses and the subject and body. You can either type in values or use fields. For the message body, use the field that we calculated previously, called “NotificationMessage”.

Summary
We’ve now configured a complete workflow that gives you real-time location awareness of your field personnel. You have a feature layer that stores all geofence intersections and are receiving instant notifications when anybody arrives at your geofences.
This is workflow can be extended using many other real-time analysis tools that are available with ArcGIS Velocity.

There are some considerations to be aware of with this workflow. For example, when users are offline, ArcGIS Velocity won’t be able to receive their LKL data and could miss events. When users are offline, data is stored locally in ArcGIS Field Maps and then synced with the historical location tracks layer when reconnected to the internet. Also, the LKL layer is only updated by Field Maps every 30 or 60 seconds, whereas the location tracks are created every few seconds. You may lose some of the temporal resolution in this analysis.
You can handle these conditions by combining this workflow with a scheduled big data analytic in ArcGIS Velocity using the historical tracks layer. Real-time analytics give you real-time awareness and big data analytics can analyze the historical data on a regular schedule (e.g. every night), covering all of your needs. We’ll be looking at this workflow in the second part of this blog soon.
To learn more about ArcGIS Velocity, explore the resources below:
- Learn more on esri.com
- Get started with ArcGIS Velocity discovery path
- Explore the ArcGIS Velocity documentation
- Connect on GeoNet
Article Discussion: