Part of our mission here at Esri is to apply geographic thinking and demonstrate technical capabilities to help our users solve the world’s greatest challenges.
As we all navigate the COVID-19 landscape we know testing, testing, and more testing is key to understanding its impact. As testing becomes increasingly accessible, we pondered how we could use our software to automate the process of identifying large numbers of potential testing locations to reach the masses.
In this blog we’ll use ArcGIS Pro and ModelBuilder, leaning heavily on the Business Analyst and Network Analyst extensions, with the idea that existing businesses could be used to occupy ideal pop-up test centers – like pharmacies. As you can see from the model – it’s extensive. But we’ll walk you through it. You can even download the model and try it yourself. Several parameters can be customized, such as the area, demographic demand, street network, etc.

Let’s Get Started
We are focusing on business locations which are assumed to have the highest foot traffic and greatest dwell times during the COVID-19 pandemic. Executive Orders across the country, including these from New York and California, have instructed that only essential businesses will be in operation. Knowing this, we are considering that individuals will only be traveling between their homes and essential businesses. Here is a list of inputs:
Location:
- We will focus on the Los Angeles-Long Beach-Anaheim, CA Metropolitan Statistical Area (MSA)
We’ll filter the following Business Analyst Infogroup business locations by NAICS codes:
- Pharmacies (for site selection)
- Grocery stores (ranking candidate sites)
- Supercenter; these include Walmart, Sam’s Club, Target, and Costco (ranking candidate sites)
Ranking criteria:
- Amount of grocery stores captured within a 10-minute drive time around the pharmacy location
- Amount of supercenter locations captured within a 10-minute drive time around each pharmacy location
- Pharmacy sales volume performance metric
Here are some additional considerations:
- A 10-minute drive time service area will be performed on all major pharmacy locations.
- The drive time radius will be used to determine the amount of grocery store and supercenter locations captured within 10 minutes of a given pharmacy.
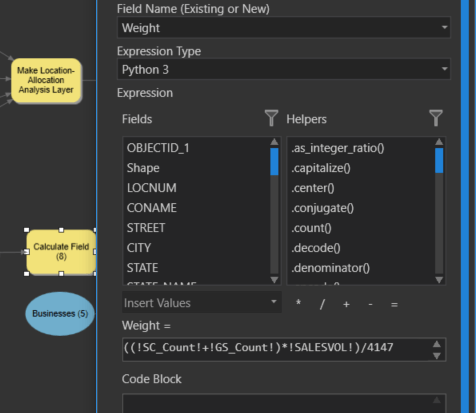
- The sales volume metric will be pitted against the total grocery store and supercenter locations to give a weighted value for each pharmacy.
- This weighted value will be used when the model is determining the most optimal locations.
The pharmacy weighted value is calculated with the following variables:
- Total grocery and supercenters per pharmacy location (GSP)
- Total sales volume per pharmacy location (SV)
- Total grocery and supercenter locations for LA MSA region (GS)
Demand:
- Block group centroids with 2019 demographic data – We’ll focus on vulnerable populations of ages 65+
Model Setup
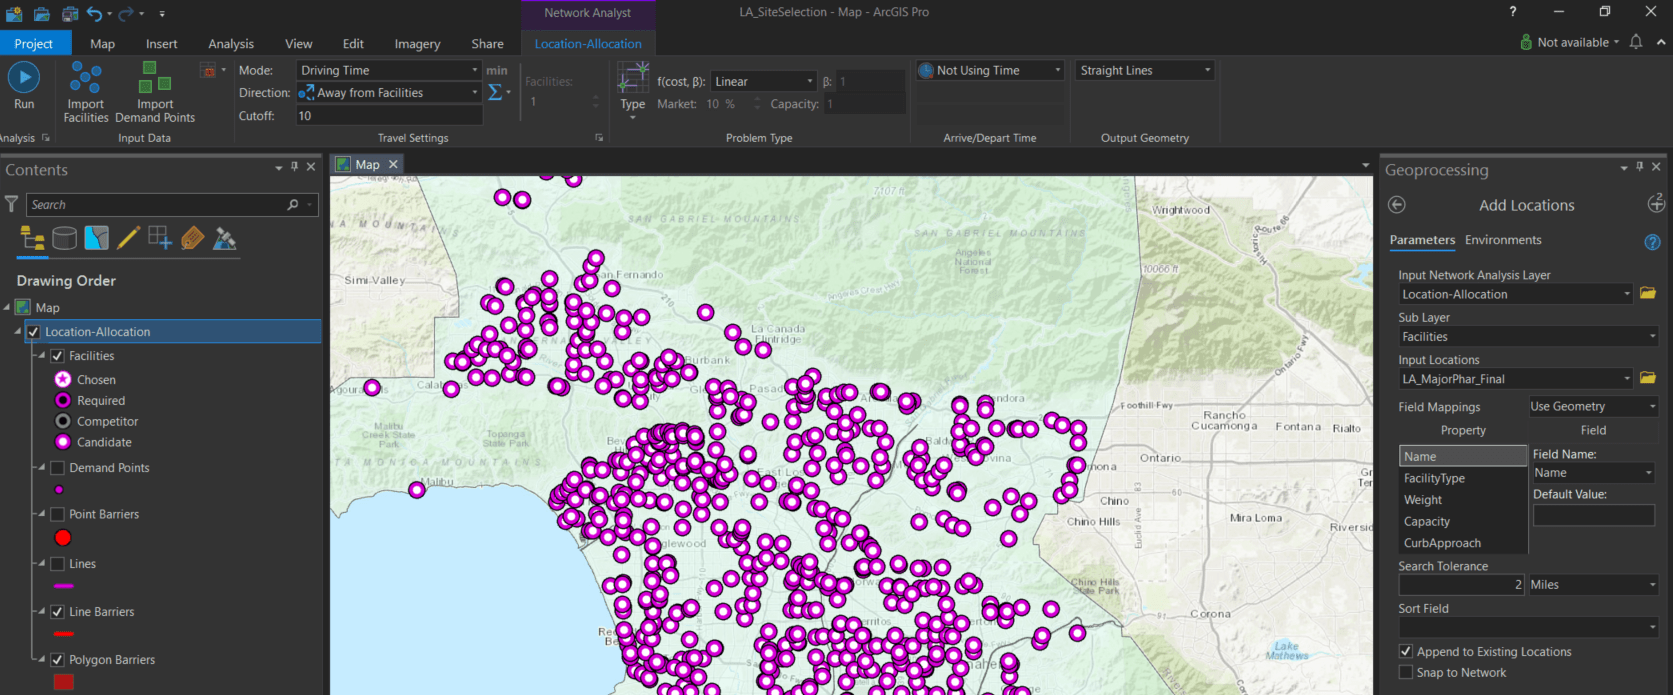
Location-Allocation analysis in Network Analyst contains several “problem types” to help find optimal locations. We will use the Maximize Coverage and Minimize Facilities to find the least number of facilities which can serve the most demand from a specific drive time cutoff value. The demand will be vulnerable population.

We will then import our facilities and classify the weighted value field for each location to be ranked under the criteria set forth in the data preparation stage. The drive time cutoff will be set to 10 minutes. There are approximately 920 major pharmacies in the dataset. Along with facilities, we will import the demand points. The demand points are represented as Census block group centroids.
Results Analysis
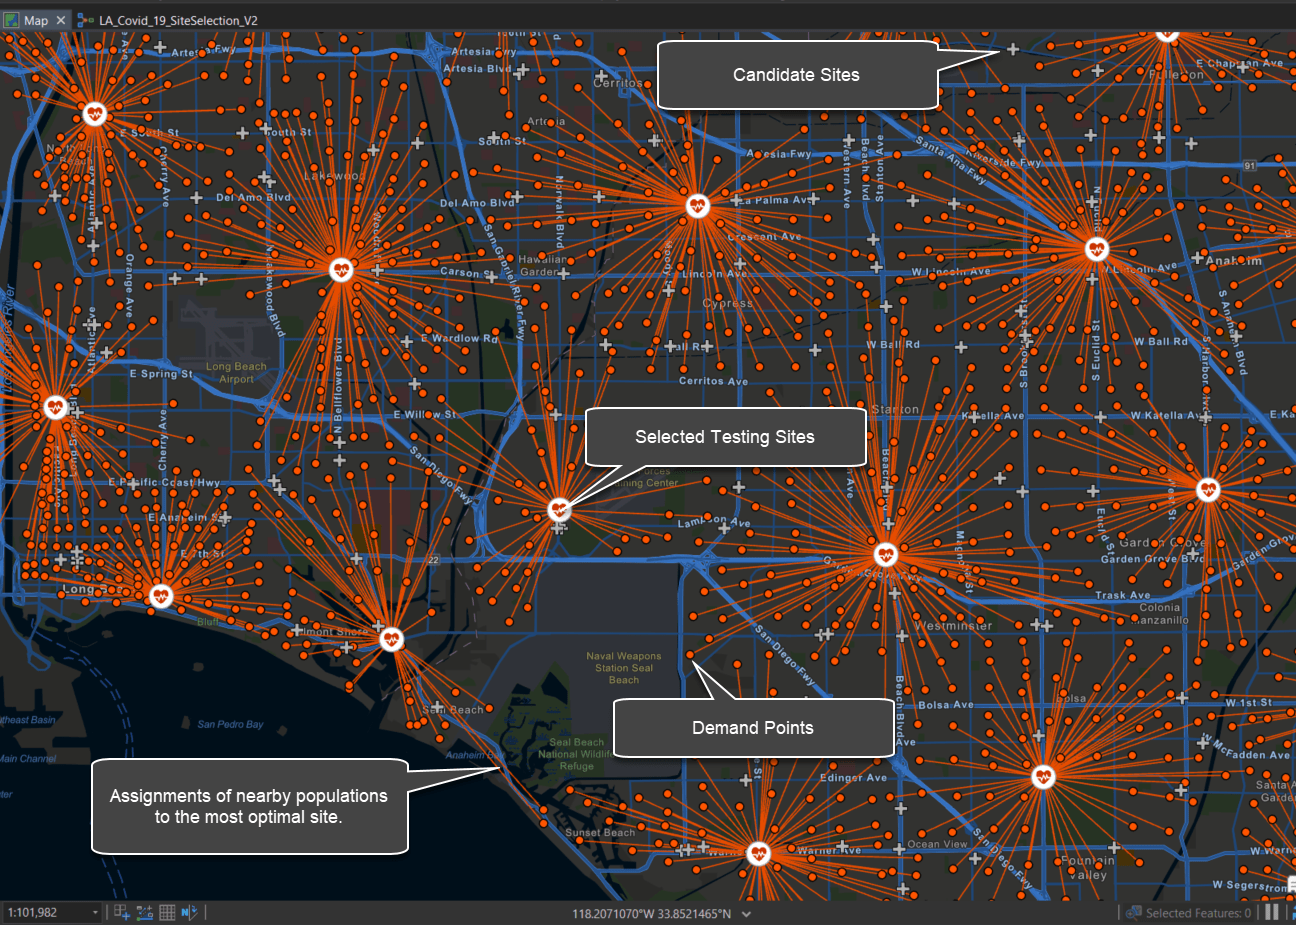
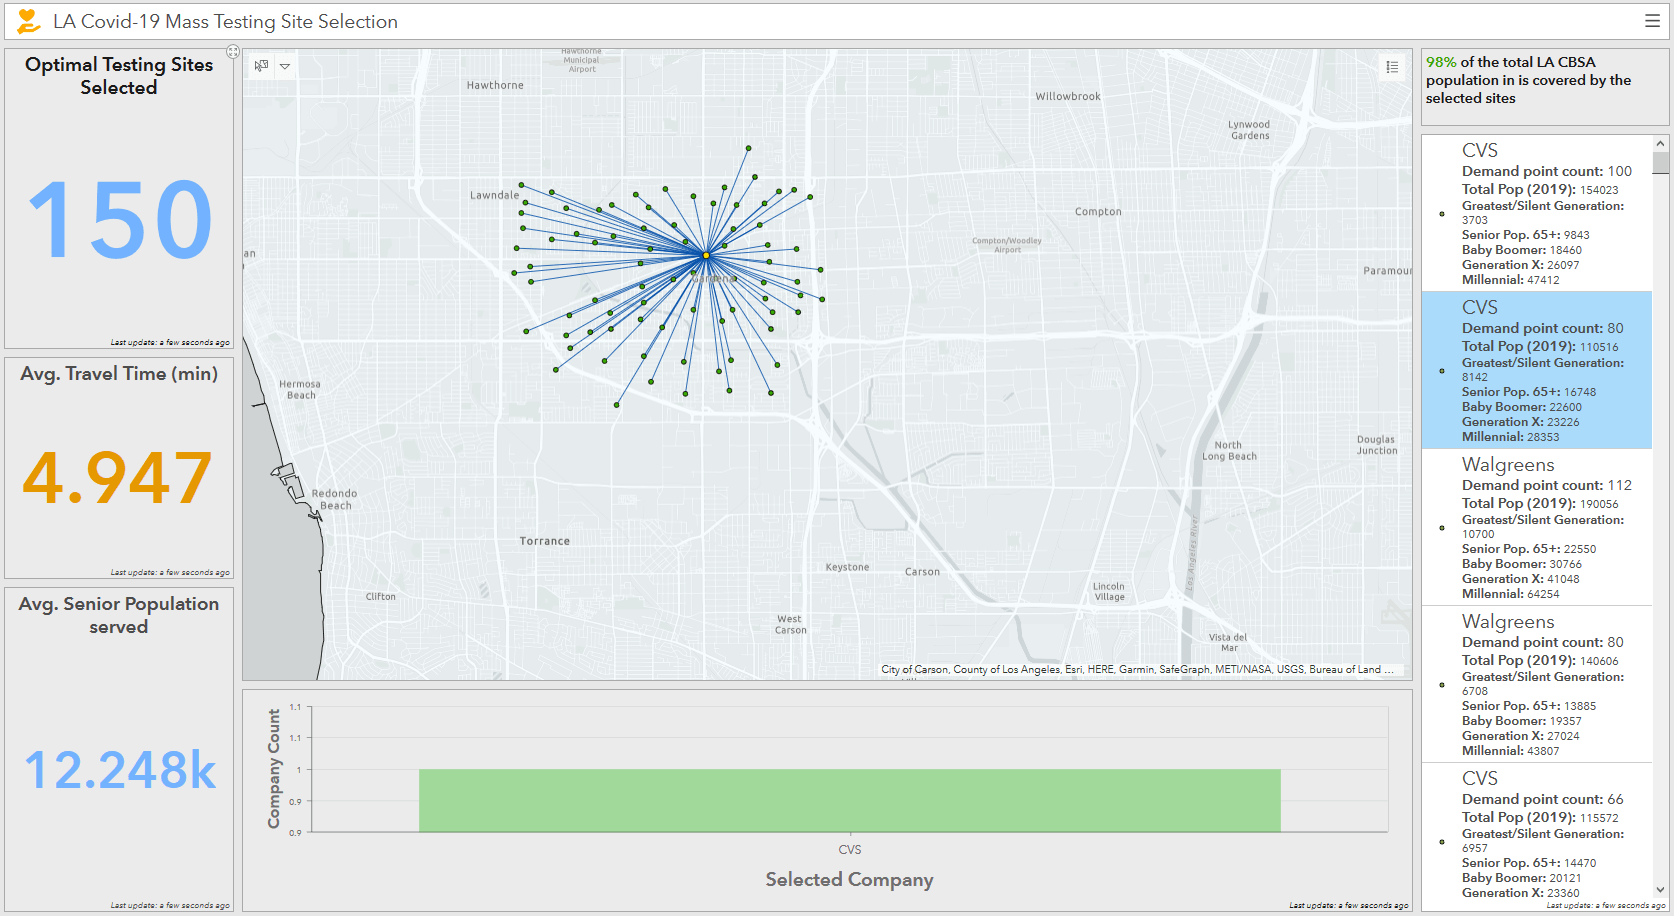
As the model outputs the results, 150 optimal sites are selected for testing locations based on the demographic demand points and weighted values for each pharmacy.
Here’s a look at the output in ArcGIS Pro. This shows the selected businesses (test sites) with “spokes” connecting the potential customers. The spokes provide a good indication of which location supports the surrounding population.
Here is another look at the same analysis output. We created a simple web-based ArcGIS Dashboard as an additional way to communicate the key findings. To build a dashboard, check out these cool options from Bern.
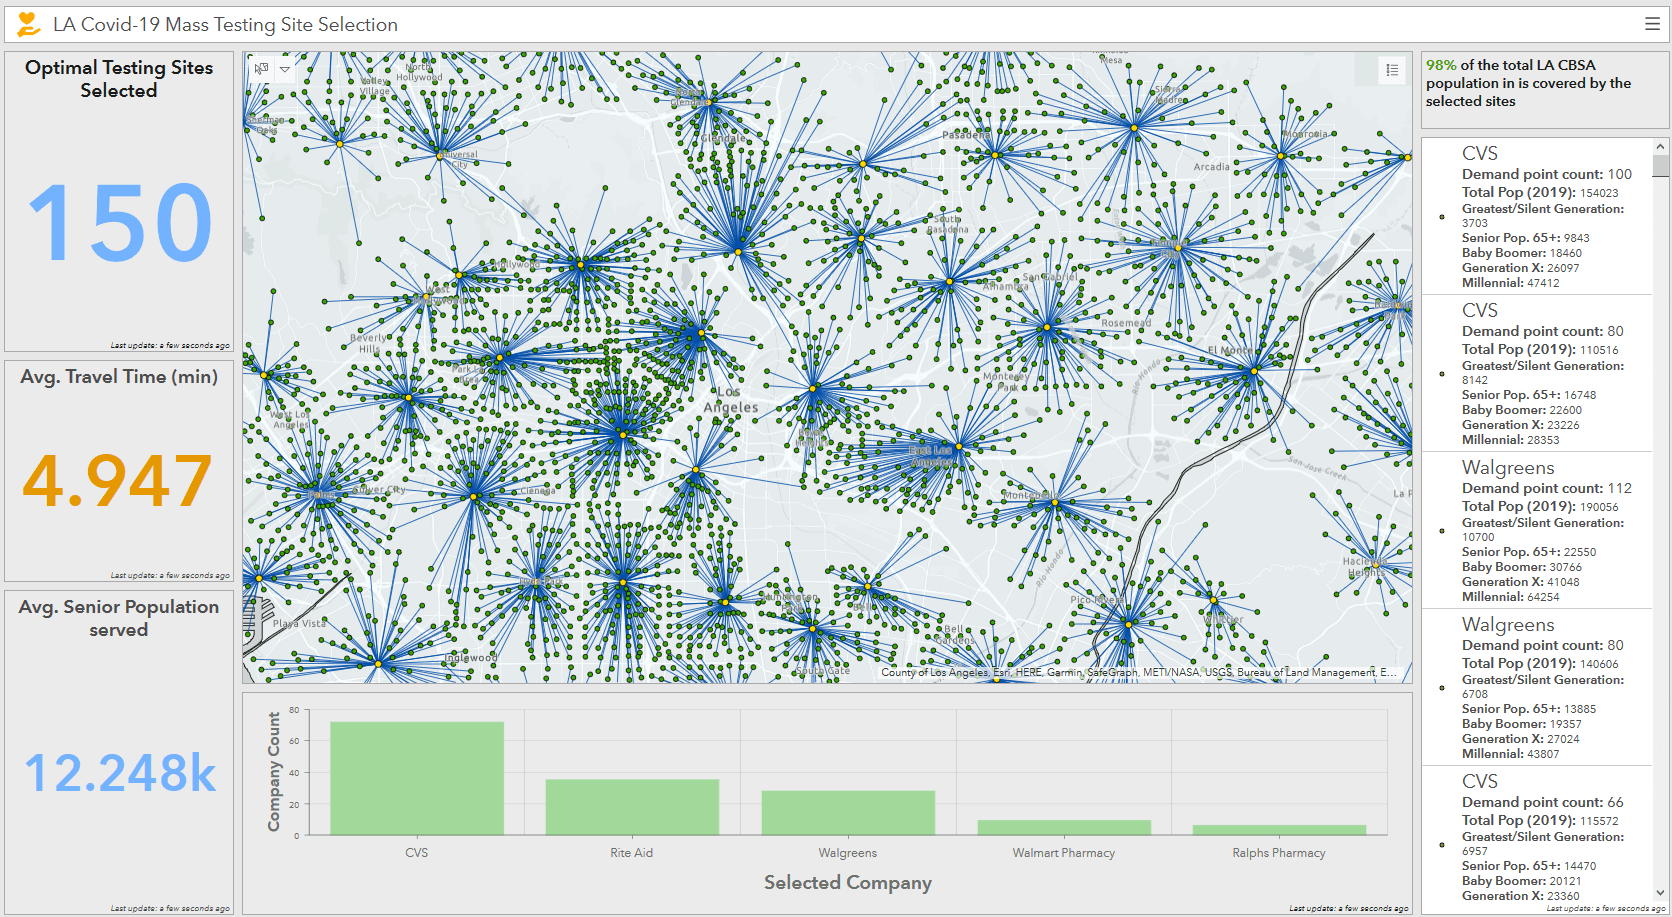
Focusing the view a bit, here is one site selected in the Gardena area of LA.
Conclusion
The model described above can help decision makers plan for expanded COVID-19 testing scenarios. It determines the most optimal facilities and which populations to direct them to. By designating specific block group geographies to specific testing locations, this allows facilities to be prepared for the incoming patients.
The results can also highlight the demand (population) and provide realistic capacity values for the potential number of COVID-19 test availability at each optimal location.

Article Discussion: