The October release of ArcGIS Maps SDK for JavaScript has arrived! We are thrilled to introduce Maps SDK Components as the new and simplified way to develop web mapping applications. This release also brings brand new capabilities such as oriented imagery, as well as frequently requested enhancements such as broader support for time-enabled data, and much more. Join us as we delve into the highlights of the release!
Maps SDK Components (beta)
We are introducing a brand-new web component library for building web mapping applications with minimal code. The component library currently consists of the three packages listed below, but will expand over time with more pre-built ArcGIS experiences (encapsulated into web components) that can be easily brought into your own app.
Map components
Map components contain the map, scene, and all of the JavaScript Maps SDK widgets wrapped as web components. While these components don’t offer new capabilities, they are a great alternative option for quickly building mapping apps and are particularly useful when integrating with frameworks.
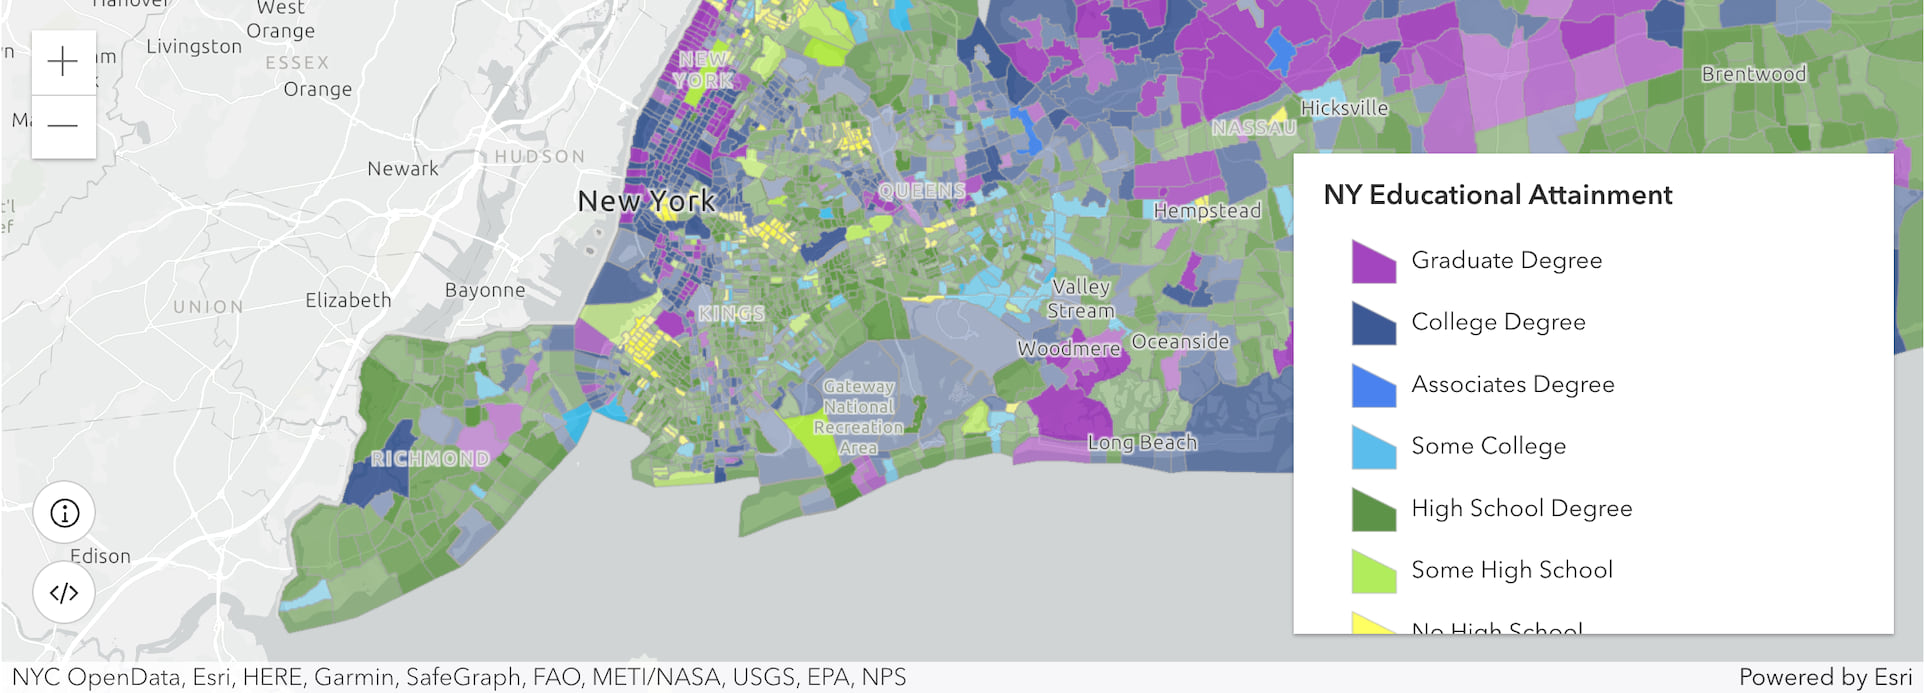
<arcgis-map item-id="05e015c5f0314db9a487a9b46cb37eca">
    <arcgis-legend position="bottom-right" />
</arcgis-map>
Coding components
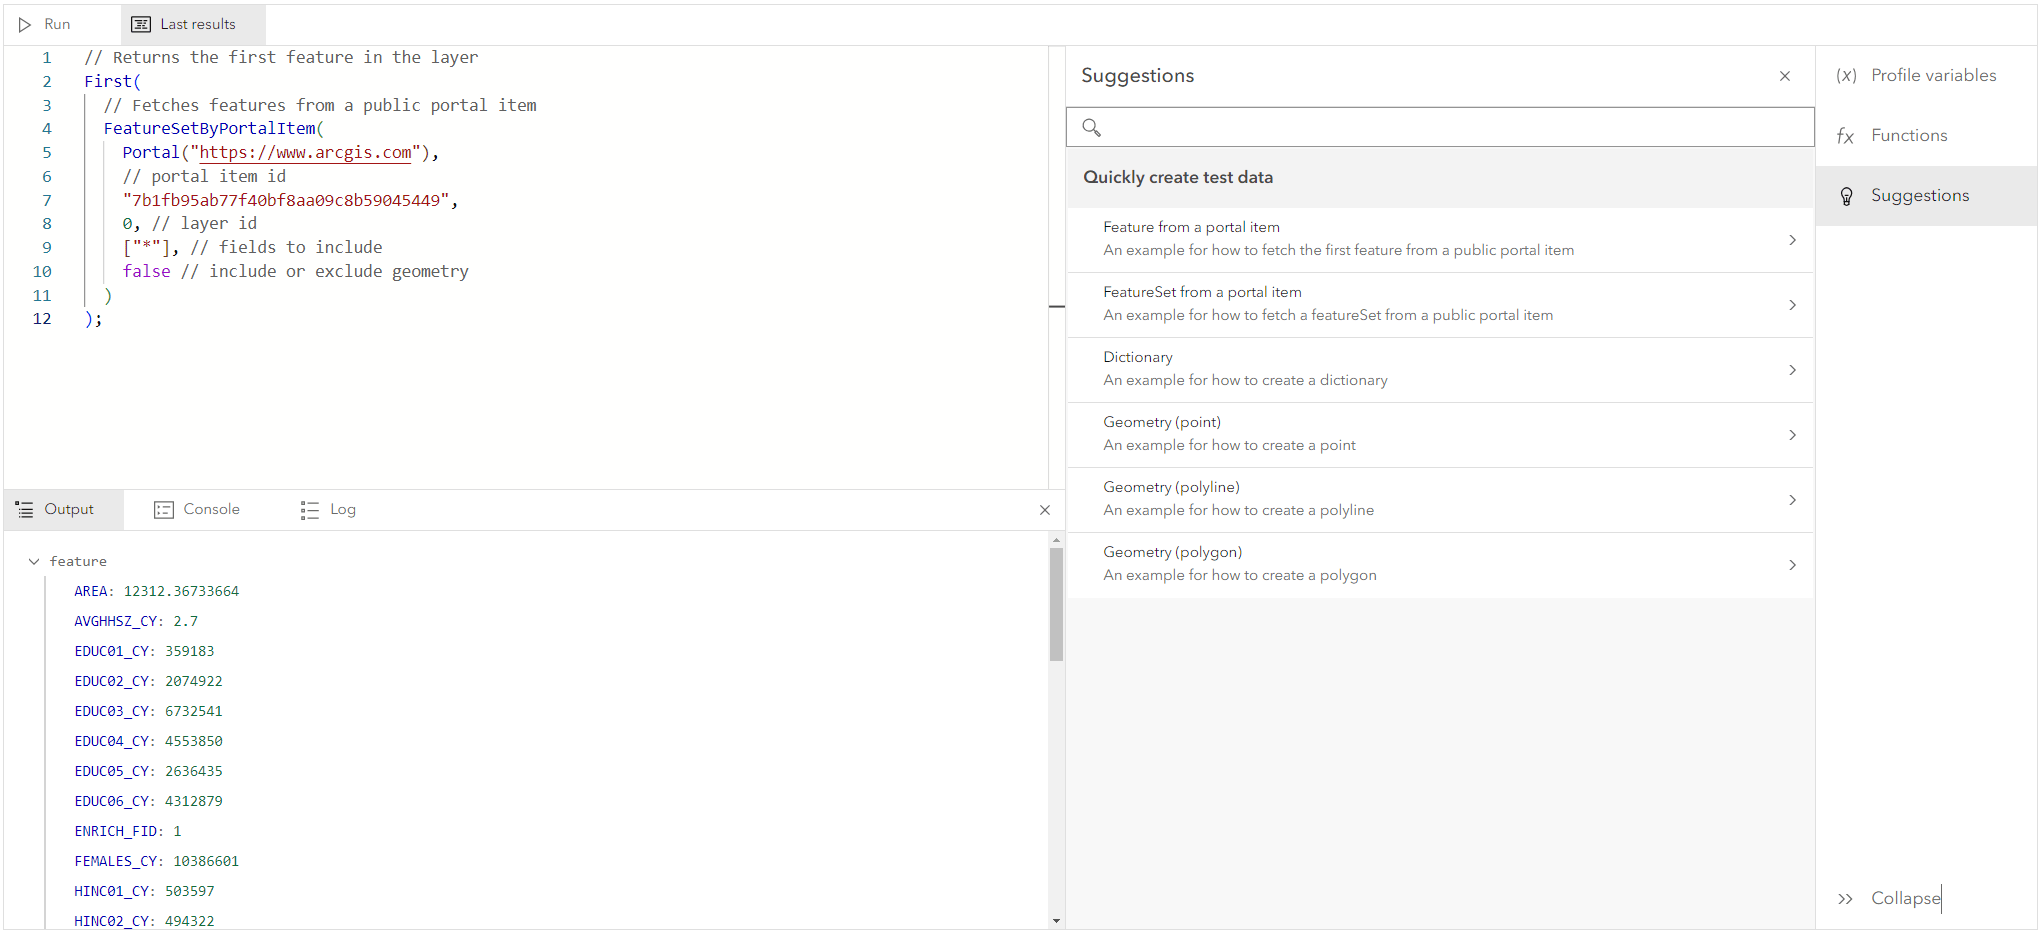
Coding components are planned to contain a wide range of tools, resources, code editors, and utilities that support coding. Currently, we offer the Arcade editor component that allows the end user to create Arcade expressions that drive aspects of your map or app within your solution. They will have the same experience editing their Arcade expressions as they do in Map Viewer and the Arcade playground.
Common components
Common components are a collection of shareable components for other high-level components, currently containing API Key and Identity for authentication. They can be used alongside with other JavaScript Maps SDK component packages to provide additional functionalities.
To learn how to use the components, check out the Getting Started guide and the new tutorials. Share your thoughts with us in Esri Community.
Oriented Imagery
Oriented imagery allows you to integrate non-traditional imagery, like street-level images taken with a mobile camera, or close-range drone inspection images, into your GIS. It connects pixels in an image to locations in a map or scene, and vice versa. This allows you to select a location on the map, and find the best image in a collection that depicts that spot. Oriented imagery is particularly valuable for monitoring situational awareness, inspecting assets, organizing non-traditional images, and managing physical infrastructure.
JavaScript Maps SDK’s new Oriented Imagery Layer enables you to interact with your collection of oriented images. The layer consists of point features displaying the camera locations and a geometry showing the area on the map that the camera covers. Using the accompanying Oriented Imagery Viewer widget, you can click on a map to view the best image in your collection that depicts that location, then examine assets from multiple directions and enhance the images for better visual analysis.
Feature-to-feature Relationship Editing
The Editor widget now can edit feature-to-feature relationship data. Prior to this release, editing was solely supported on data related via feature to table. Like feature-to-table relationship editing, the relationship element enables you to configure the relationship within the form template and will be automatically recognized by the editor widget.
Improved Experience for Date and Time
This release introduces new ways to work with time data, including new field types to better represent dates with different levels of information, and time zone support for 2D MapView and widgets.
New field types (beta)
Three new date-focused field types were added this release — date-only, time-only, and timestamp-offset — to represent different levels of information when working with date and time values.
With the new timestamp-offset fields, we can compare data across time zones, as detailed in this blog about how to leverage this new field when working with temporal data.
See the release notes for more information about each field type and when to use them.
Time zone
Time zone support in the 2D MapView enables you to have control over how dates and times are represented to users within the view. In previous versions, the date and time values were always displayed in the time zone of the device. Setting the time zone can be useful for displaying events like weather alerts or emergency incidents that are best conveyed in the local time zone of the incident for coordination and response purposes. Widgets that display dates will respect the time zone as well.
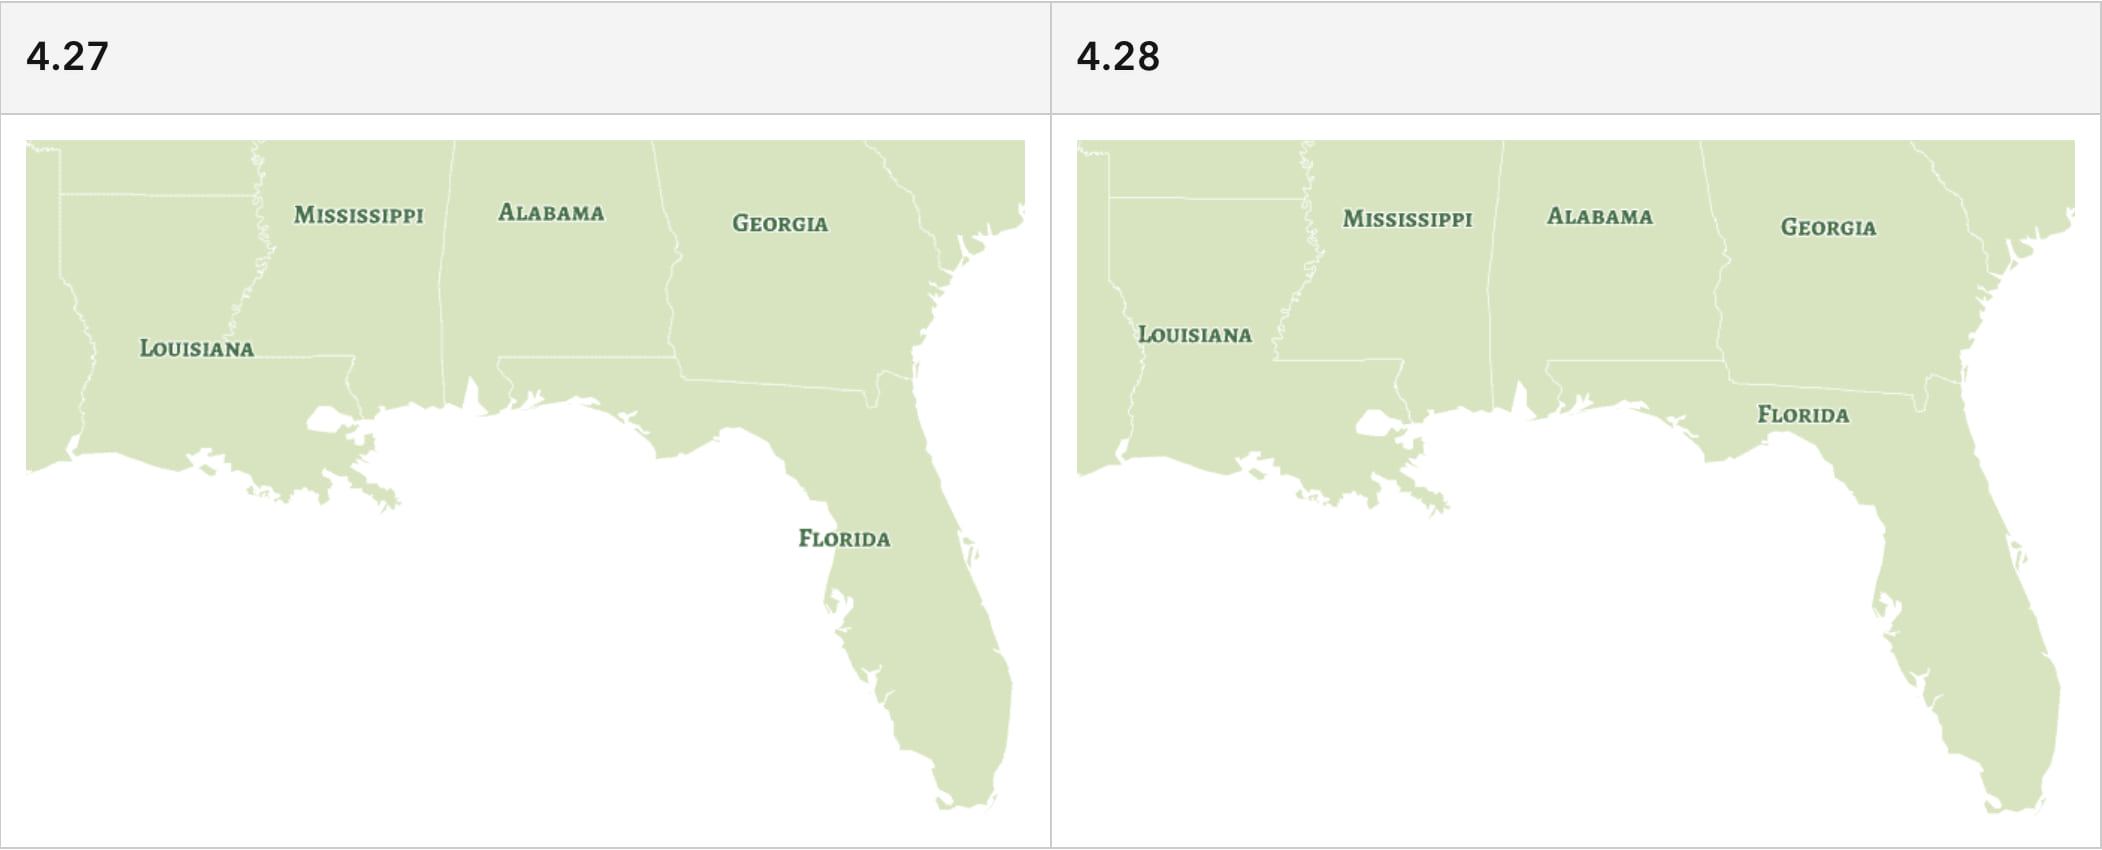
Enhanced Polygon Label Placement
We have enhanced label placement for polygon features in 2D MapViews. The polygon labels are better positioned inside the features, particularly for irregular shapes such as the state of Florida.
New Basemap Styles API
This release brings support for a new basemap styles API with localized place labels from the basemap styles service (v2). These basemaps can be created from a string in the form of {provider}/{style}, where provider is “arcgis” or “osm”. In addition to style, you can also specify a language for the labels. If no language is specified, the app’s current locale will be used to determine the language of the place labels.
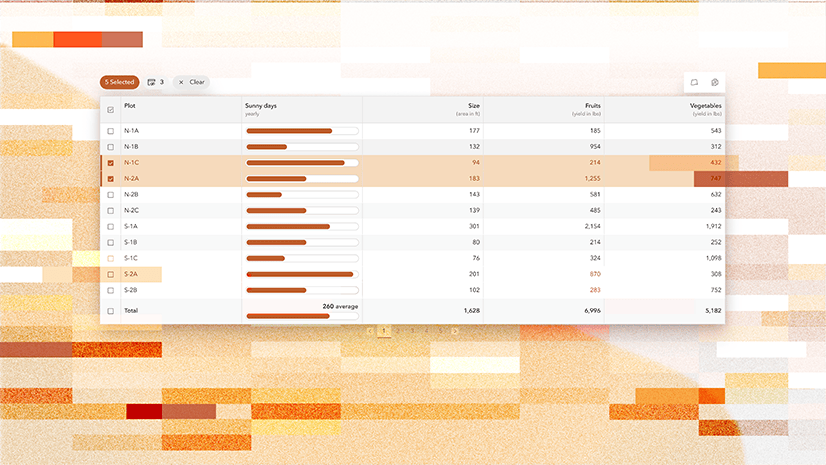
Color Theming for Interactive Tools
You can now customize the color of interactive tools in both 2D and 3D to align with the design and branding of your site. Tools such as sketching, snapping, measuring, dimensioning, slicing, line of sight, and the elevation profile can all be customized with your preferred color. This customization enhances the application’s style, improves user-friendliness, and adds a more integrated feel to the overall user experience.
3D Updates
With the support of zip file uploads, it is now possible to add models that have additional texture files to editable scene layers.
Improved memory estimations, which allows us to render more features on higher-end devices. On lower-end devices, we may now render fewer features to improve performance and stability.
Our 3D basemaps can now be loaded by referencing a string id. The list of available basemap styles which can be loaded by string id can be found here.
Show background color while terrain loads
When loading a VectorTileLayer with a background color set, this color will now be displayed instead of the grid which offers a smoother transition when navigating between different parts of a map that haven’t loaded yet. Using the ArcGIS Vector Tile Style Editor, you can also add a background color to your own vector tile layers to benefit from this change.
Animated GIF/PNG in Media Layer
GIF and APNG images are now supported in media layer, allowing you to include animated images in your web mapping apps. You can specify animation options such as duration and repeat type for these animated images. Adding animated images to your web mapping apps has never been easier.
Vector Tile Layer Initial Extent
When using vector tile layer, the view can be automatically zoomed to areas that contains information by setting the view to the new initialExtent property in vector tile layer. This is particularly useful when you are referencing a tile set with very limited coverage.
2D Performance in Non-GPU Environments
GPU is a basic requirement to achieve a positive experience with any modern mapping application, including apps built with the JavaScript Maps SDK. Organizations should review system requirements (which includes having a GPU) when allocating hardware to ensure applications can be run with acceptable performance.
We recognize that some customers are limited to using under-allocated systems that don’t have access to a GPU. In order to assist customers in this situation, the SDK was updated to automatically attempt to improve map interaction in no-GPU environments.
Learn More
In addition to updates above, version 4.28 offers a range of exciting enhancements, including saving more layer types as portal items, custom chart colors, raster function utility methods, and new color ramps! Check out the release notes, play around with the new samples to learn more about 4.28, and discuss the release with us on Esri Community!
Join us on Thursday, November 2nd at 9am PT for the YouTube Livestream, where you can hear directly from the engineers who worked on the release, see more captivating demos, and have any questions you may have clarified!
Are you coming to Esri European Developer Summit on November 14–16 , 2023 in Berlin? We have planned a variety of technical presentations on key topics and ample opportunities to connect with the team at the showcase.


Article Discussion: