In 2021, the ArcGIS API for JavaScript had four successful releases and brought you a lot of new features, bug fixes, and enhancements.
Here’s a quick look at the year by the numbers: 126 new classes, 81 support bugs fixed, and 34 samples added/updated. Let’s take a look back at the main highlights of this past year.
ES modules
We started out the year with the production release of ES modules at version 4.19. ES modules make it easier to do local builds of the API when integrating with third party frameworks and build tools. They are available for installation via the NPM package @arcgis/core.
Haven’t tried ES modules yet? Visit the Introduction to tooling guide topic to learn more about the new modules and whether you should migrate. There are also sample apps that demonstrate the basic concepts for getting started.
Performance improvements in 2D
One of the main themes over our four releases this past year was improving performance. We are always trying to make our API load faster and run more efficiently.
- Point FeatureLayers: We improved the performance of point FeatureLayers hosted on ArcGIS Online and ArcGIS Enterprise. Once loaded, the features won’t need to be re-requested from the server, which makes panning and zooming much faster.
- Complex polygons & large layers with many polygons: For complex polygons with a large number of vertices, layer draw time has significantly improved as of version 4.21. These improvements vary layer by layer, but in most cases you will see a 2-3 improvement in your layer draw time. These changes have also improved the performance of layers with a large number of polygon features, resulting in a 20% improvement in draw time.
- Reduced memory usage: In version 4.22, we reduced memory usage up to 50% for applications with FeatureLayers using simple polygons and simple polygon outlines by streamlining how vertex data is encoded. This will help increase stability on resource-constrained devices such as phones and tablets.
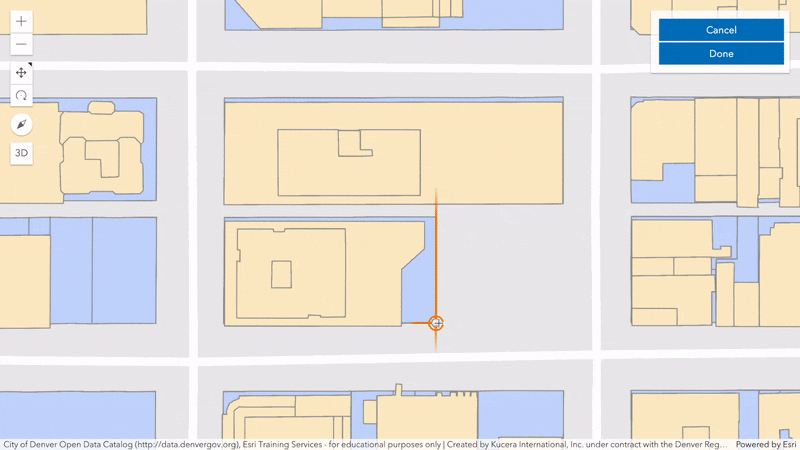
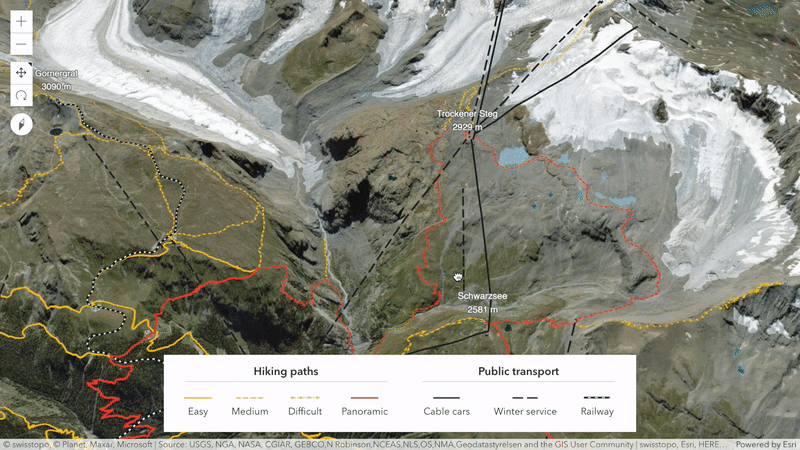
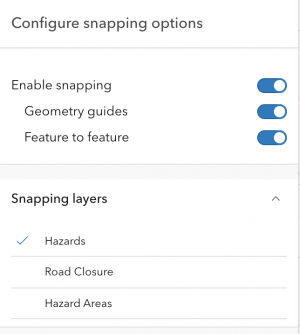
Snapping
Another big highlight of 2021 was support for snapping in 2D and 3D. Snapping provides the ability to visualize parallel and perpendicular lines when drawing, and helps users connect newly drawn features to other existing features and vertices.
3D support
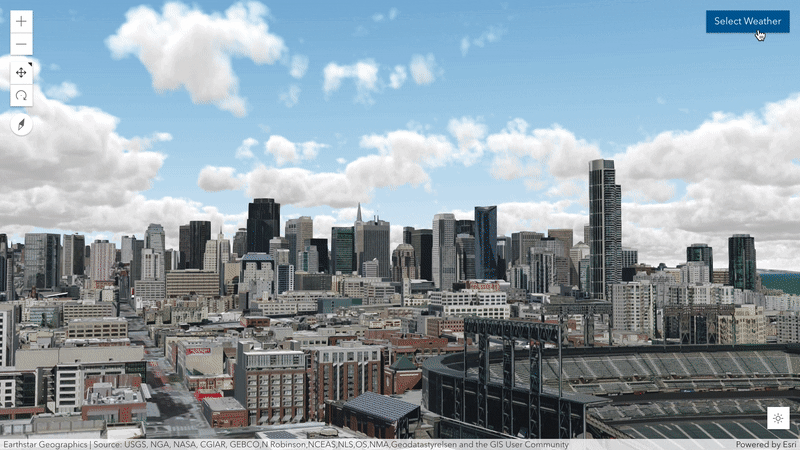
On the 3D side of things, we’ve made many enhancements over the past year to improve your experience with scenes.
- Weather support: Make your scenes more realistic by adding weather. A new property on SceneView.environment allows you to configure a range of weather conditions from sunny to cloudy and even foggy.
- Line patterns: Use patterns on lines or polygon outlines to symbolize additional information, for example to differentiate between planned and existing features. A new class LineStylePattern3D provides a variety of styles compatible with existing 2D capabilities. Patterns can be driven by attribute values and combined with visual variables.
- Improved sketching experience: Polygon edges and polyline segments can be offset using new manipulators provided by the SketchViewModel. We also added support for line and polygon transformations, allowing you to scale a geometry in 3D while keeping its proportions.
- Improved rendering quality: A new lighting and shading model adds more contrast and definition to your 3D content.
New layers
- WFSLayer: Create a layer from an OGC Web Feature Service (WFS). The WFS service must support WFS 2.0.0 and have GeoJSON output format enabled.
- SubtypeGroupLayer: A single FeatureLayer composed of sublayers for each subtype in the individual feature service. This layer type improves the experience for feature layers with many suptypes (such as utility network datasets).
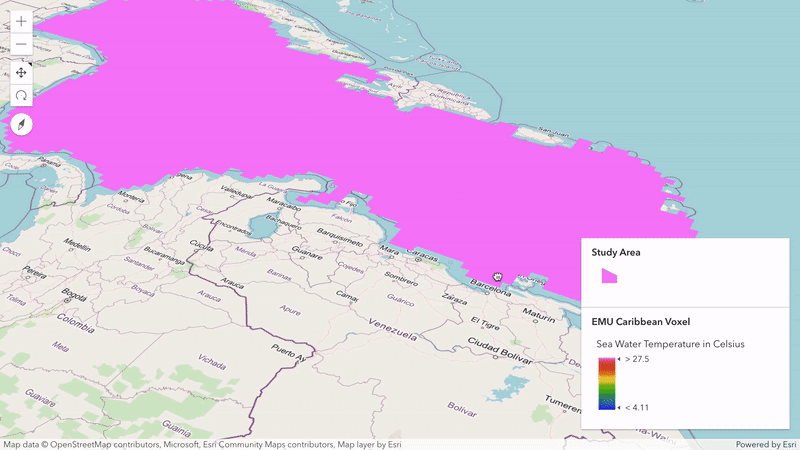
- VoxelLayer (beta): Allows you to display multidimensional volumetric data in local scenes.
New widgets
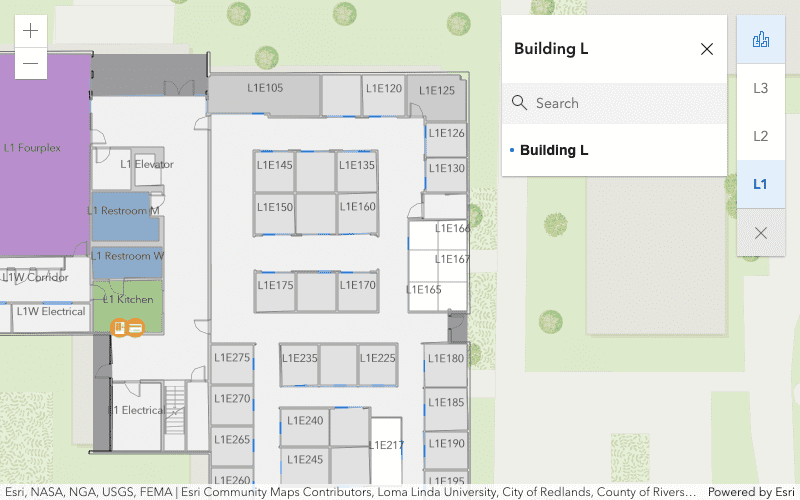
FloorFilter: Filter features from floor-aware layers to control visualization in MapView and SceneView.
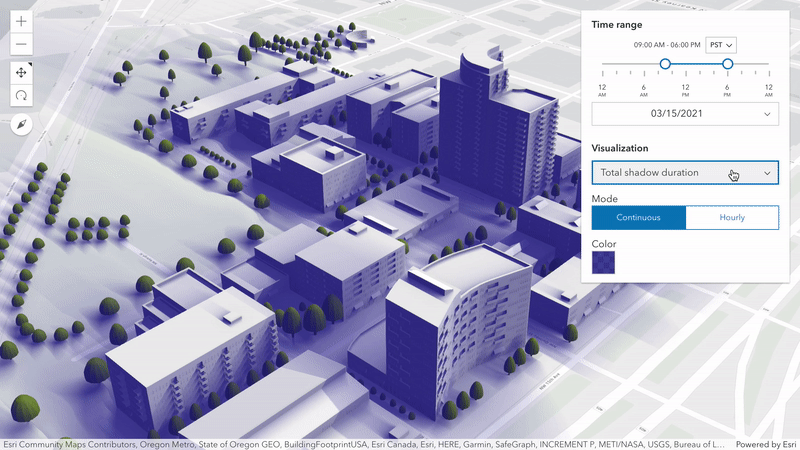
ShadowCast: Analyze the total shadow duration from buildings and other 3D objects in your Scene.
SnappingControls: Provides a simple user interface to handle all snapping functionality.
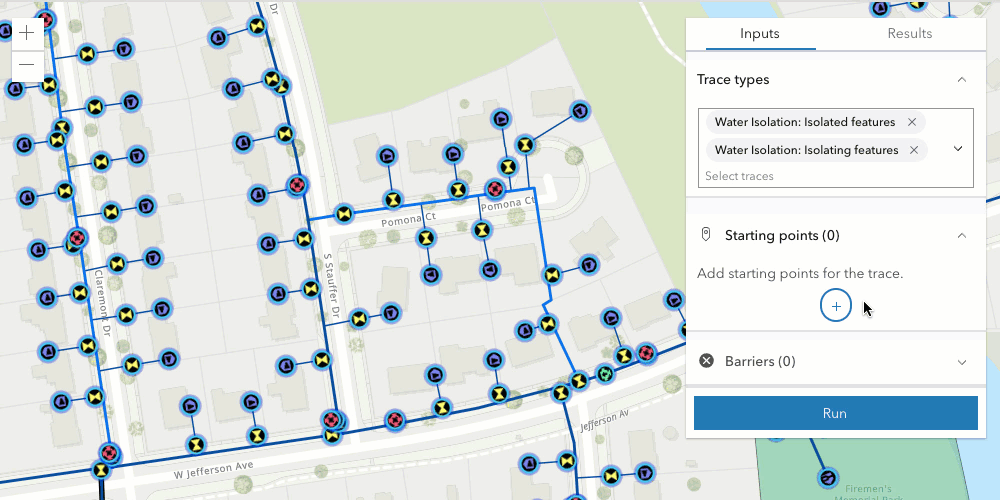
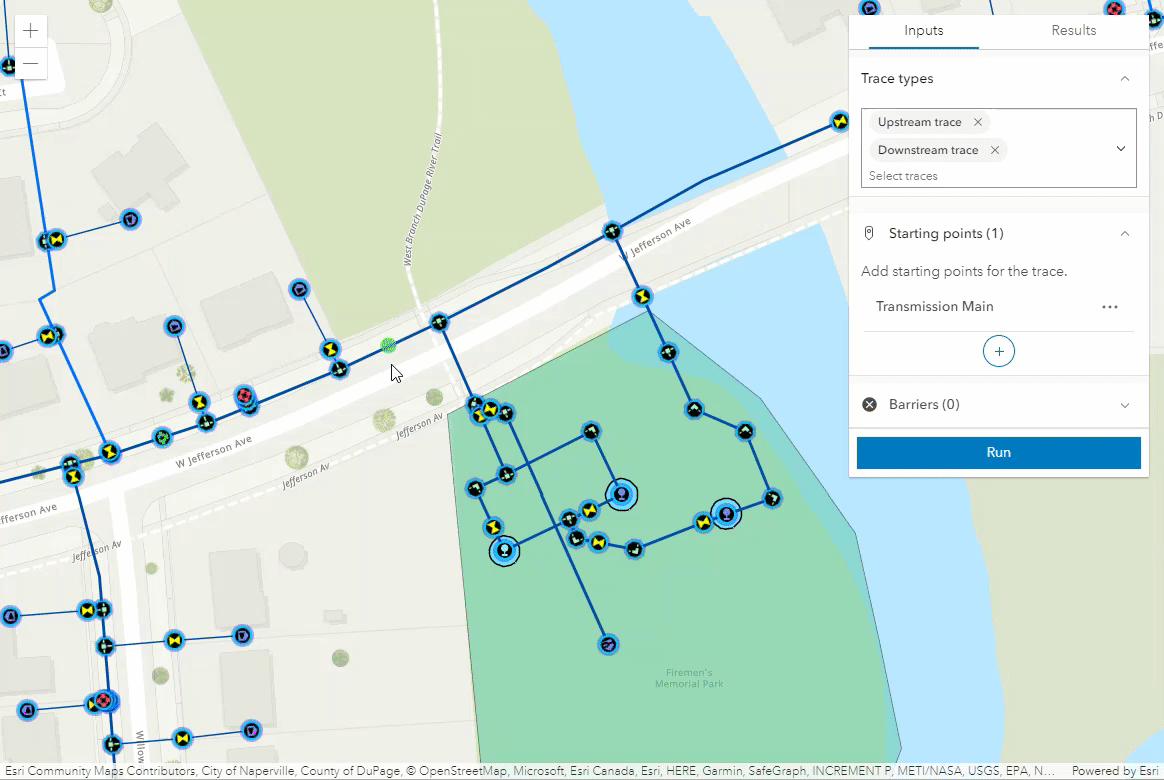
UtilityNetworkTrace: Trace how resources flow through a utility network.
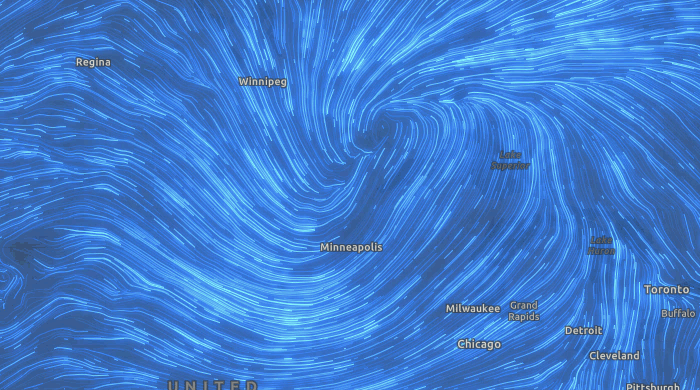
Visualize flow with the AnimatedFlowRenderer
The AnimatedFlowRenderer (released in beta) allows you to visualize your UV or MagDir raster data with animated streamlines. This renderer can be used to visualize flow direction and magnitude information in ImageryLayers and ImageryTileLayers in a MapView. The direction of the raster defines the direction of movement, and the magnitude defines the visible length of the streamline.
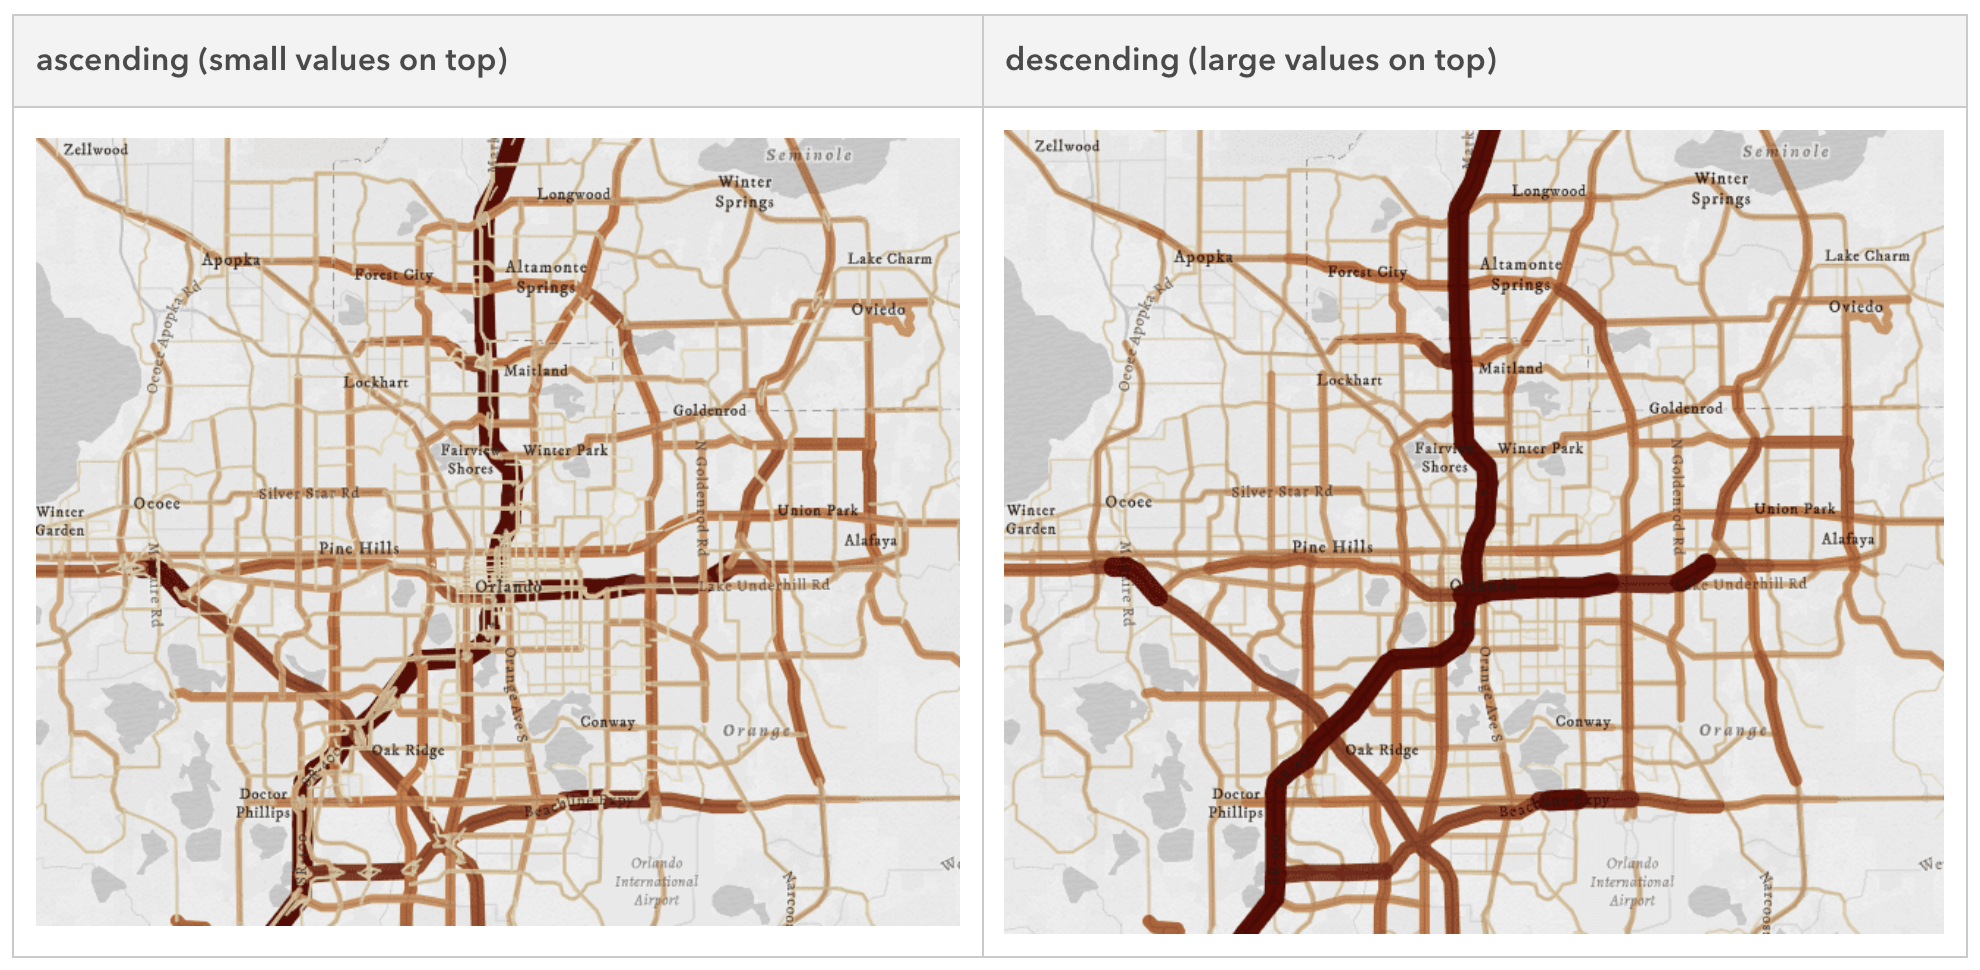
Control the drawing order of features
You can configure the order features are drawn in the view by setting the orderBy property of a FeatureLayer, CSVLayer, GeoJSONLayer, and OGCFeatureLayer. This property allows you to sort features using any field or Arcade expression that returns a number or a date.
ArcGIS Platform and API keys
In January 2021, Esri announced a new product called ArcGIS Platform. The ArcGIS API for JavaScript supports this using API keys. You can either specify a global API key or use more fine-grained API keys for greater flexibility when using multiple keys or multiple authentications.
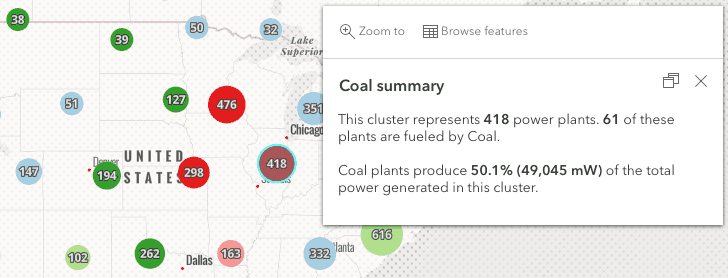
Display more information in cluster popups
Support for clustering was added in 2020, but we’ve continued to make updates and improvements to allow you to do more with your clusters in 2021. One major update is that you can now access clustered features using Arcade expressions within the cluster popups using $aggregatedFeatures. This allows you to display more detailed information in your popup about the features that are in each cluster. You can also browse clustered features from within the popup.
Utility network support
Over this past year, we’ve worked on adding support for utility network in the ArcGIS API for JavaScript. The SubtypeGroupLayer and UtilityNetworkTrace widget mentioned earlier were part of this work. To learn more about utility networks in the JSAPI – take a look at the following blogs: What’s new in Utility Network JavaScript API 4.21 and Trace a Utility Network with the ArcGIS API for JavaScript.
Documentation updates
Visualization guide topic
The data visualization guide was revamped with more than 28 new conceptual topics and five chapters. Explore the guide to learn about visualization best practices, the various layer styles available in the JS API, and browse the hundreds of symbols and color ramps provided for easy copy/paste use in your apps.
CIM symbol builder
The CIM symbol builder was updated to support lines and polygons. Combine different symbol layers, update symbol layer properties, and watch how the CIMSymbol updates.
Calcite Design System guide page
This new guide page details how you can use the Calcite Design System in your applications. Browse the library of Calcite icons and view samples that use Calcite components with the ArcGIS API for JavaScript.
Happy new year!
Thank you for spending 2021 with us. This blog just provides an overview of the features added this past year. For more detailed information about each release this year, visit the release notes for 4.22, 4.21, 4.20, and 4.19. Have a favorite new feature? Let us know in the comments below!


Article Discussion: