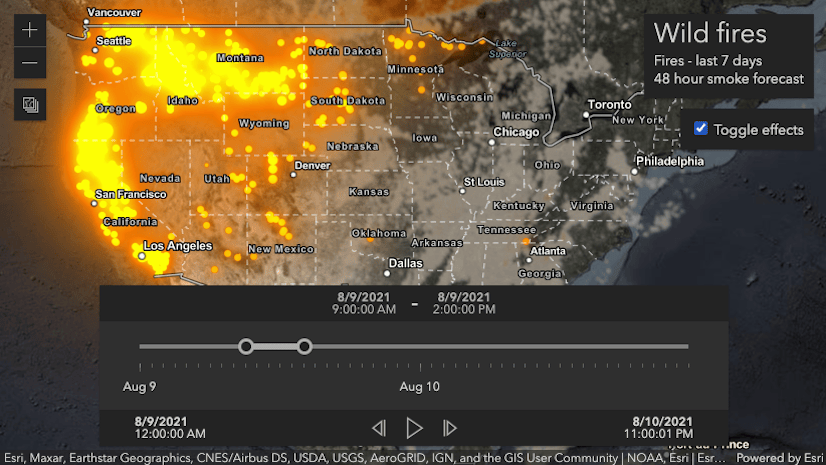
Air quality is an essential aspect of our daily lives and significantly impacts our health and overall well-being. As we approach wildfire season in California and witness rising carbon emissions across the globe, being aware of the air quality in our surroundings becomes even more important.
There’s no shortage of maps visualizing air quality, but in this blog I’ll discuss how you can use animated symbols to draw attention to areas with unhealthy or hazardous air quality. To do this, I’ll take advantage of the animation capabilities in CIM symbols in the ArcGIS Maps SDK for JavaScript.
What’s a CIM symbol?
CIM symbols are complex, multi-layer vector symbols that can be used to visualize point, line, and polygon features. They can be comprised of one or more symbol layers with a variety of properties, giving you extensive control over how your symbol is visualized. With CIM symbols, you can create unique, custom symbols that fit your needs.
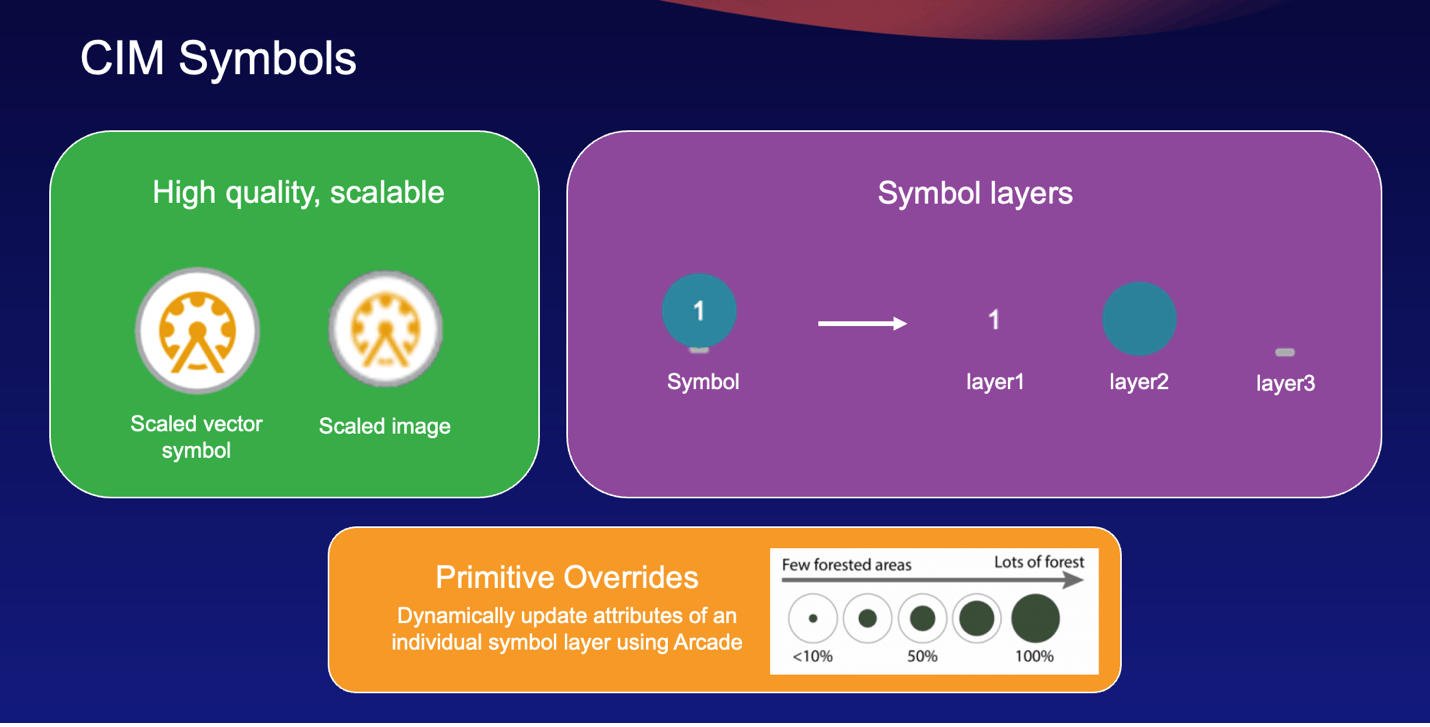
Another aspect of working with CIM symbols is that you can use primitive overrides, which allow you to dynamically update the property of a symbol layer (primitive) based on a feature attribute or Arcade expression.
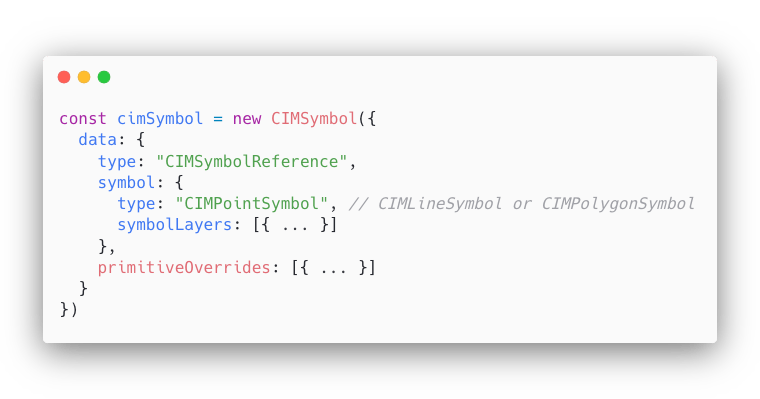
CIM symbols are created based on a JSON object of a CIMSymbolReference that follows the cim specification, which is used to define symbology across ArcGIS products.
For more information on CIM symbols, you can check out this blog or this presentation from the Developer Summit.
CIM symbols + animation
You can add animation to your CIM symbols with animated GIFs or PNGs in a CIMPictureMarker symbol layer. At version 4.24, we added support for a variety of animation properties that give you more control over how your GIF will animate, such as the duration, startTime, repeatType, and more.
You can also use primitive overrides with any of these properties, tying them to a feature attribute or Arcade expression. For instance, I want features with high air quality to animate faster than those with lower air quality. To do this, I’ll set a primitive override on the duration property, returning a shorter duration when the air quality is high, and a longer duration when air quality is low.
Now that you have a bit of background information, let’s get into how the app was built.
How the app was built
Getting the data
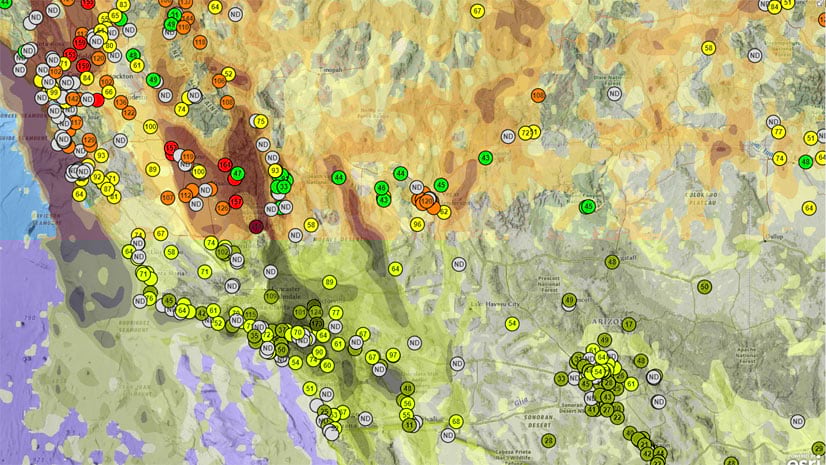
The first step when creating a mapping application is always finding the right data, and the first place I like to look for data is the Living Atlas. The Living Atlas contains a variety of layers, maps, and applications about air quality. In this app, I’ll use the OpenAQ Recent Conditions in Air Quality layer, which is a live feed containing air quality information from OpenAQ.
Creating the CIM symbol
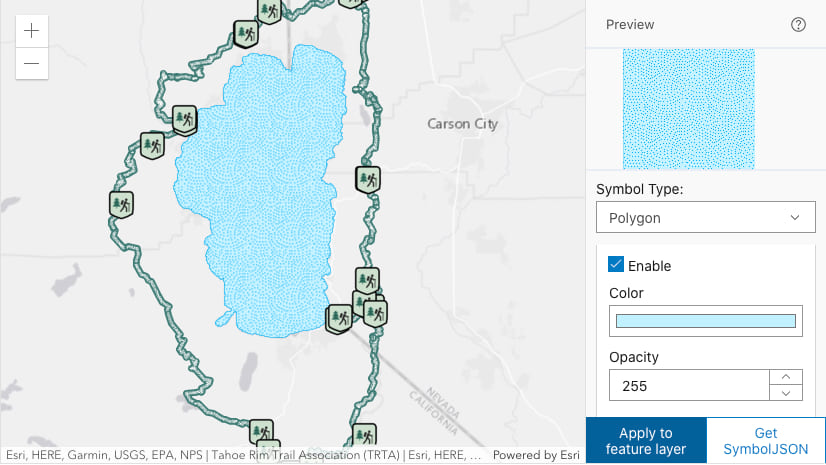
Once we have the data, the next step is to symbolize it in the map – I’ll do this using a CIM symbol. As I mentioned earlier, CIM symbols are created from a JSON object based on the CIMSymbolReference. This JSON can get quite large and can be cumbersome to write from scratch, so that’s where the CIM Symbol Builder can help. It is a tool that provides a simple UI for creating CIM symbols, allowing you to add symbol layers, adjust their properties, visualize the symbol in a map, and then copy out the JSON to use when you’re done. For more info on the CIM symbol builder, check out this blog post.
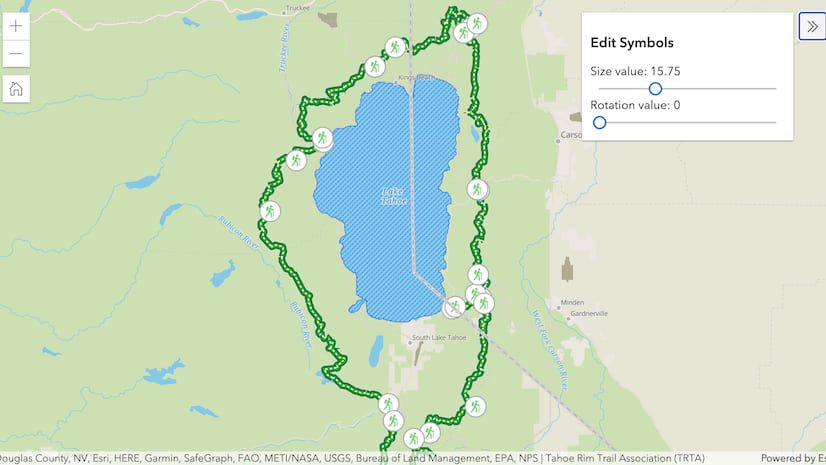
Using the CIM Symbol Builder, I first added a circle CIMVectorMarker symbol layer (found under the shapes tab), and then I added a CIMPictureMarker symbol layer (found under the Custom tab). I replaced the URL to the image to a GIF from Wikimedia commons of a blinking white circle, as shown in the illustration below.

After playing around with the colors and sizes of each symbol layer, I clicked the “Get Symbol JSON” button to copy out the symbol JSON and use it in my app.
I placed the symbol JSON in a function called createCIMSymbol(). I updated the CIM JSON by adding the animatedSymbolProperties to my CIMPictureMarker symbol layer. This allowed me to set the animation to “Loop” and reduce the length of the animation.
{
  type: "CIMPictureMarker",
  enable: true,
  size: 25,
  scaleX: 1,
  tintColor: [255, 255, 255, 255],
  url: "https://upload.wikimedia.org/wikipedia/commons/f/fb/Cercle_white_blink.gif",
  animatedSymbolProperties: {
    playAnimation: true,
    duration: 0.75,
    repeatType: "Loop"
  }
}
Since we’ll use the createCIMSymbol function to create multiple CIM symbols of different colors, we’ll pass in color r, b, g as a function argument, and update all instances of color in the symbol to use those values.
function createCIMSymbol(r, g, b) {
  return new CIMSymbol({
    data: {
      type: "CIMSymbolReference",
      // primitiveOverrides: [],
      symbol: {
        type: "CIMPointSymbol",
        symbolLayers: [{
          type: "CIMPictureMarker",
          enable: true,
          size: 25,
          scaleX: 1,
          tintColor: [r, g, b, 255],
          url: "https://upload.wikimedia.org/wikipedia/commons/f/fb/Cercle_white_blink.gif",
          animatedSymbolProperties: {
            playAnimation: true,
            duration: 0.75,
            repeatType: "Loop"
          }
        },
        {
          type: "CIMVectorMarker",
          enable: true,
          anchorPoint: {x: 0, y: 0},
          anchorPointUnits: "Relative",
          size: 22,
          frame: {xmin: 0, ymin: 0, xmax: 17, ymax: 17},
          markerGraphics: [{
            type: "CIMMarkerGraphic",
            geometry: {...},
            symbol: {
              type: "CIMPolygonSymbol",
              symbolLayers: [{
                type: "CIMSolidFill",
                enable: true,
                color: [r, g, b, 125]
              }]
            }
          }],
          scaleSymbolsProportionally: true,
          respectFrame: true
        }]
      }
    }
  });
}
We’ll use this symbol with a ClassBreaksRenderer on our layer to separate the air quality into 6 categories based on the Level of Concern from the EPA – Good, Moderate, Unhealthy for Sensitive Groups, Unhealthy, Very Unhealthy, and Hazardous.
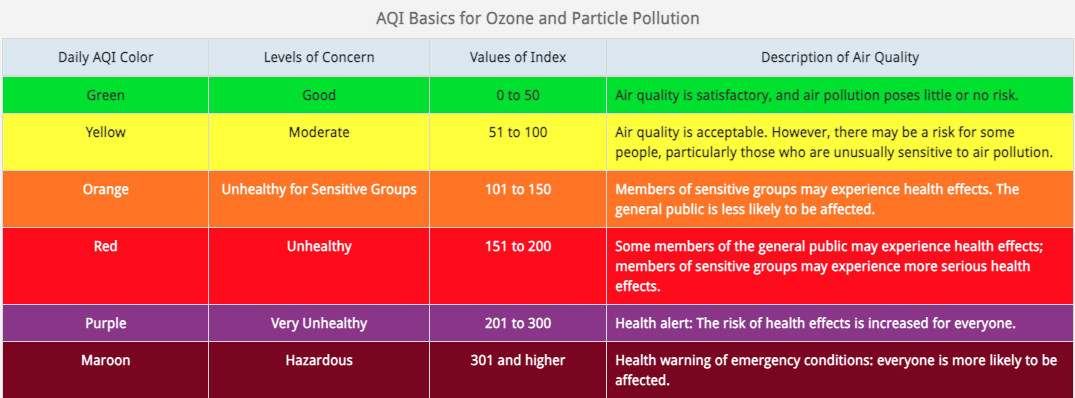
For each of these categories, we’ll use the same symbol but with a unique color, based on the AQI level of concern.
layer.renderer = {
  type: "class-breaks",
  field: "OZONEPM_AQI_SORT",
  legendOptions: {
    title: "Ozone & PM AQI"
  },
  classBreakInfos: [
    {
      minValue: 301,
      maxValue: 5000,
      symbol: createCIMSymbol(126, 0, 35),
      label: "Hazardous"
    },
    {
      minValue: 201,
      maxValue: 300,
      symbol: createCIMSymbol(143, 63, 151),
      label: "Very Unhealthy"
    },
    // continue with the rest of the AQI categories
    {...}
  ]
};
Making it data driven
Now that we’ve created our symbol, it’s time to add some data behind it. Lots of flashing circles doesn’t make for a great map, so let’s start by only playing the symbol’s animation when the air quality of a feature is “Unhealthy”, “Very Unhealthy”, or “Hazardous”.
We’ll add a primitive override on our symbol for the playAnimation property. We want this property to be true if the air quality is “Unhealthy” or worse, otherwise, we want this property to be false. To create a primitive override for our symbol, we first need to give it a primitiveName – we’ll call this “animationOverride” – and determine the property that we want to override – PlayAnimation. Then we need to apply this same primitiveName within the object of the property we want to override.
function createCIMSymbol(r, g, b) {
  return new CIMSymbol({
    data: {
      type: "CIMSymbolReference",
      primitiveOverrides: [{
        type: "CIMPrimitiveOverride",
        primitiveName: "animationOverride",
        propertyName: "PlayAnimation",
        ...
      }],
      symbol: {
        type: "CIMPointSymbol",
        symbolLayers: [
          {
            type: "CIMPictureMarker",
            enable: true,
            size: 25,
            scaleX: 1,
            tintColor: [r, g, b, 255],
            url: "https://upload.wikimedia.org/wikipedia/commons/f/fb/Cercle_white_blink.gif",
            animatedSymbolProperties: {
              primitiveName: "animationOverride",
              playAnimation: true,
              duration: 0.75,
              repeatType: "Loop"
            }
          },
          { ... }
        ]
      }
    }
  });
}
Next, we’ll create an Arcade expression from the Arcade visualization profile that will determine the value of playAnimation for each feature. We’ll use an Arcade comparison operator to determine if the AQI of a feature is greater than or equal to 151, then it’s unhealthy and we want the symbol to animate (so the expression will return true). Otherwise, the expression will return false.
primitiveOverrides: [{
  type: "CIMPrimitiveOverride",
  primitiveName: "animationOverride",
  propertyName: "PlayAnimation",
  valueExpressionInfo: {
    type: "CIMExpressionInfo",
    expression: `$feature.OZONEPM_AQI_SORT >= 151`
  }
}]
Now we should only see animations where the air quality is Unhealthy, Very Unhealthy, or Hazardous.
Let’s add a little more meaning to the animation by updating the duration of each animation based on the hazard level. The more hazardous the air quality, the faster we want the animation to oscillate. We can do this by adding another primitive override on the Duration property. We can use the same primitive name because the property we want to override is still within that animatedSymbolProperties object on our CIMPictureMarker symbol layer.
Using Arcade’s When function, we can calculate when the AQI is considered “Unhealthy”, “Very Unhealthy”, and “Hazardous”, and update the duration of the animation to 1, 0.5, and 0.35 seconds, respectively. This will cause the animation to blink much faster at “Hazardous” levels than “Unhealthy” levels.
primitiveOverrides: [{
    type: "CIMPrimitiveOverride",
    primitiveName: "animationOverride",
    propertyName: "PlayAnimation",
    valueExpressionInfo: {
      type: "CIMExpressionInfo",
      expression: `IIF($feature.OZONEPM_AQI_SORT >= 151, true, false)`
    }
  },{
    type: "CIMPrimitiveOverride",
    primitiveName: "animationOverride",
    propertyName: "Duration",
    valueExpressionInfo: {
      type: "CIMExpressionInfo",
      expression: `When(
        $feature.OZONEPM_AQI_SORT >= 151 && $feature.OZONEPM_AQI_SORT < 200, 1,
        $feature.OZONEPM_AQI_SORT >= 201 && $feature.OZONEPM_AQI_SORT < 300, 0.5,
        0.35
      )`
    }
}]
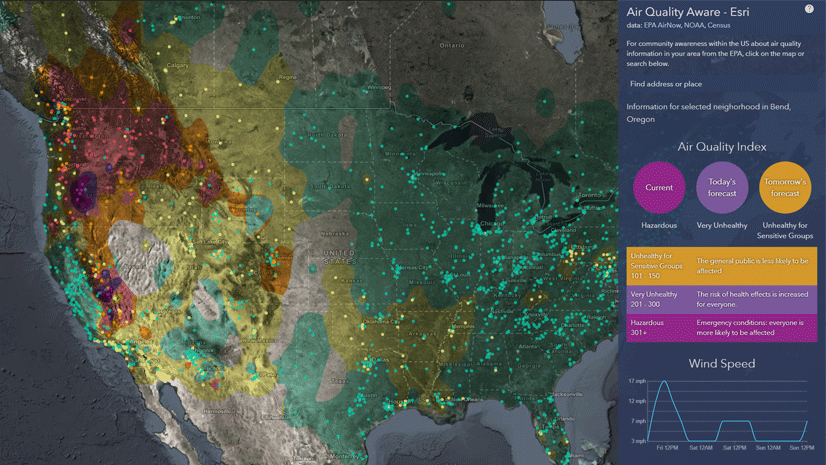
View the app to see this animation in action and click the Find worst AQI button in the top right to quickly view the feature with the highest AQI in the map. You can find the source code for the app here.
Conclusion
In conclusion, animated CIM symbols can help users quickly see where the air quality is Unhealthy or Hazardous. Using animations in your maps can help bring your data to life and provide additional context for users at a quick glance.
On the ArcGIS Maps SDK for JavaScript team, we are working on adding additional symbol animation capabilities, but would love to hear from you! What type of animations do you want to see supported? Let us know about any use cases you might have — feel free to email me or post in the comments below!

Article Discussion: