Our cartographic colleague, John Nelson wrote an interesting blog post that examined the impact of regional language to name places in the United States. The geographer in me was able to appreciate the spatial representation of named places, but the geodev in me just wanted to play with those 2.3 million points!
I had to take a step back and think about how this might work for a moment. 2.3 million points is still a lot of features to display in a FeatureLayer, and still wouldn’t work as Vector Tiles. At small scales, it’s simply not possible to render that much vector data in the browser.
But good old raster tiles could do it. Once a tile is cooked, it’s cached, it’s fast, and it always works! I could still take advantage of displaying the data as a FeatureLayer at larger scales too. So I obviously needed a hybrid approach.
Upload data
John was kind of enough to provide the data he worked with as a geodatabase. You can find the link in his post. The next step, probably simplest step, was to upload the data into my Online account.

Once I upload the data, Online will create an item for the geodatabase that was uploaded and automatically create a Feature Layer.

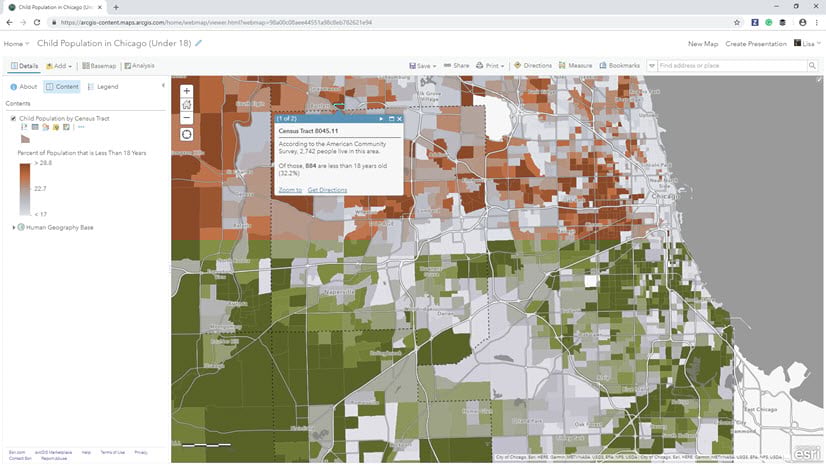
Once the data has been uploaded, I can view it in the the Visualization tab of the item details. I won’t be able to see all the data, it is over 2 million points, but it sure is going to try.

The first thing I’m going to do is zoom in to a reasonable scale so I can work on the map visualization. Now I need to define how I want to visualize this data.
I’m going to use an Arcade expression to find the place names that contain either “Gap”, “Pass”, “Notch”, or “Saddle”.
var gap = Find("Gap", $feature.NAME);
var pass = Find("Pass", $feature.NAME);
var notch = Find("Notch", $feature.NAME);
var saddle = Find("Saddle", $feature.NAME);

if (gap > 0) {
    return "Gap";
}
if (pass > 0) {
    return "Pass";
}
if (notch > 0) {
    return "Notch";
}
if (saddle > 0) {
    return "Saddle";
}
I’m going to use the Arcade Find function to find the names that match in our data. Once that is done, I need to visualize my data. Using Johns map as a guide, I can pretend to be a decent cartographer!

The next thing I can do is to configure my popup. I’m just going to show the place name, with the county and state.

With this done, I can now save the layer, and move on to the next step of creating my tile layer.
Tile Layer
Normally, I would open up ArcGIS Pro, cook tiles locally on my machine, and then upload them in to my online account. But what if you don’t have Pro? It’s ok, you can publish tiles from feature layers directly in Online. When you publish tiles, they will be generated with the source feature layer styling. Something to keep in mind when you publish your tiles. If you need to change the style of your layer before creating tiles, you can create a hosted feature layer view, and publish tiles from that view.
I have plans for these tiles, so I know I don’t need to cook tiles at a very large scale, I only need them down to maybe the County or Metropolitan Area level, so when I publish my tiles I can adjust the scale range to meet my needs.

Another key here is to make sure I leave the checkbox for Create tiles automatically checked. This will delay the creation of tiles until they are requested. Once a tile is created, it’s cached and available for all subsequent requests. That’s a really great feature of publishing tiles from a feature layer.
Even though I want some tiles to be dynamically created, I can still tweak this a bit more, so the first users to view an area at a small scale don’t pay the penalty of waiting for a tile to be generated. I can go into my tile layer and build tiles at selected scales. I could even build tiles for a defined extent!

Normally I would have probably prebuilt the tiles at the three smallest scales, but I had already done some earlier, so I’m going to build tiles for the two smallest scales.
Now I know what you’re thinking. How many credits are you burning through here to build all these tiles? I’m glad you asked. When you do a batch build of tiles like I did, you will get a message that gives you an estimate of how much storage they will take and how many credits it will use. In my case I received the following message.
You are about to create 107139 tiles. This will require an estimated 643.85 MB of additional storage space. Creating these tiles will cost an estimated 10.714 credits.
That was for a little over 100,000 tiles. For 11 credits. That’s it. There are about 7,400 other tiles in my tile layer, so that costs less than maybe a credit to build.
But the cost of storage must be a lot right? Tiles and data storage currently costs 1.2 credits per 1GB stored a month. The 100,000 tiles I’m currently building is less than 650MB. To put that into perspective, you can sign up for a free ArcGIS Developer account and you get 50 credits a month. Plus, there is no per view cost. Only creating and storing the tiles. You can’t get much better than that.
Creating and consuming a WebMap
Now that I have my tile layer and my feature layer, I can combine them both inside of a WebMap. Once I’ve added both these layers into my WebMap, I can adjust the visible scale range for each. I’ll use the tiles at smaller scales and when I zoom in past a certain scale, where I have decided to not cook tiles, I can turn on the feature layer. This is probably the easiest part, because I have already styled my layer and my tiles are already cooking at the scale ranges I defined. I set the scale range for my feature layer to just slightly larger than when the tiles will stop drawing. This way I can avoid having both layers visible at the same time.
Even though I am using tiles to display data at smaller scales in my map, I can still enable the popup in my tile layer. This way the tiles are still completely interactive with the popup displaying information from the source feature layer where it was configured.
With my WebMap published and ready for viewing, I can quickly consume that WebMap in the ArcGIS API for JavaScript using the item id.
const map = new WebMap({
  portalItem: {
    id: "5c7bffd977d34ed0a4e8d60f9b6a5b91"
  }
});
You can see this WebMap of 2.3 million features in action in the demo below!
Gap, Pass, Notch, or Saddle
Summary
Viewing millions of features in a web mapping application requires a little planning. You can’t just create a feature layer or vector tiles and cross your fingers. But mix some raster tiles into it and now you are cooking! A hybrid approach works great in this scenario, and using the advantages of raster tiles with the combination of fast Feature layers, you can create a map to display millions of features in your web mapping applications.

Commenting is not enabled for this article.