ArcGIS Pro 2.3 and ArcMap 10.7 Spatial Analyst tools now support a new environment, the Cell Size Projection Method, to control the calculation of the output raster cell size when datasets are projected during tool execution. To learn more about projections, see Coordinate systems, projections, and transformations.
In previous software versions, the cell size was converted using a linear unit conversion when projecting from a Projected Coordinate System (PCS) to another PCS or an angular unit conversion when going from Geographic Coordinate System (GCS) to another GCS. So, projecting a 30 meter raster dataset from UTM zone 10N to WGS84 Web Mercator would continue to use 30 meter as the output cell size. When projecting from GCS to PCS or vice versa, previous versions took an average cell size based on the ratios of diagonal lengths in source and destination projections. Therefore, this method, currently exposed as the ‘convert units’ method simply copied the cell size from input to output, changing units if necessary.
This approach has some limitations:
- It does not account for distortion when projecting from one PCS to another PCS (1 projected meter in, say, a UTM zone at a given location may not cover the same ground distance as 1 projected meter at the same location in an Albers projection).
- When computing the ratios of diagonal lengths, the behavior of the projection at only the four corner points was used. This may have introduced excessive distortion, depending on the projection and the extent.
The two new methods: ‘preserve resolution’ and ‘center of extent’ both are intended to calculate a projected cell size that doesn’t change the ground distance of the cell, thus avoiding unnecessary resampling during an implicit projection operation happening as a Spatial Analyst tool or a feature to raster conversion tool executes. You should use the ‘center of extent’ method when you know the geographic location where your cell size is most accurate. If you use this method, you can use a raster with a small extent in that same area as the cell size source or create a temp raster ‘around’ that location and use that as the cell size source. If you are unsure, use the ‘preserve resolution’ method. To learn more about the three cell size projection methods see How the Cell Size Projection Method environment setting works.
If you do not know at which specific geographic location your cell size is best but want to improve on the ‘convert units’ method when a projection is involved while working with Spatial Analyst tools, you can use the ‘preserve resolution’ method.
Why use the resolution preserving cell size projection method?
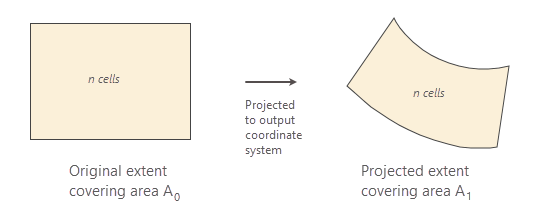
In the ‘preserve resolution’ method the same number of square cells as are in the original extent are preserved in the projected extent. The output cell size is calculated based on the ratios of the areas of the projected extent to the original extent. This approach is based on how Esri software currently chooses a cell size when moving from a camera image coordinate system to a geodetic (GCS or PCS) system. This method calculates the average size of a square cell more accurately for all combinations of GCS and PCS than the default ‘convert units’ method.
If the areas of the original rectangular extent and (shape preserving) projected extent are A0 and A1, then the areas of the square cells, respectively, are, ca0 = A0/n and ca1 = A1/n
Since the number of cells remains constant for both cases, the ratio of the area of extent to the area of the square cell are equal, A0/ca0 = A1/ca1

So, the output cell area is ca1 = (A1/A0) * ca0
and the output cell size is CellSize_projected = √((A1/A0) * ca0)
In this method, the cell size conversion factor is, √(A1/A0)
Let’s look at two examples to see how the ‘preserve resolution’ method picks a better output cell size than ‘convert units’.
Example 1:
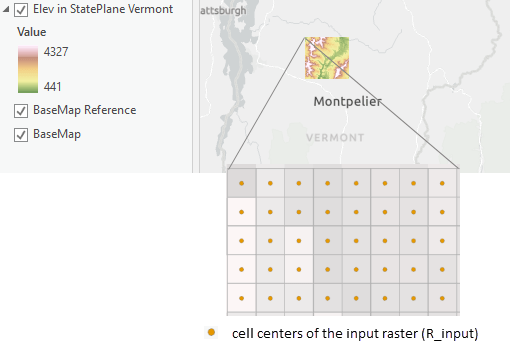
Let’s take an elevation raster (R_input), located in Vermont (Figure 2), in a PCS (NAD_1983_StatePlane_Vermont_FIPS_4400) and project it to another PCS (WGS 1984 World Mercator) using the default cell size projection methods, ‘convert units’ (R_out_CU) and ‘preserve resolution’ (R_out_PR). Here both the spatial references are shape preserving, where the input spatial reference is suitable at a state level and the output spatial reference is suitable for the entire world. We will then compare the geodesic distance between the cell centers to determine which method preserves the geodesic distance more accurately.

Before we compare the geodesic distances between the two methods, lets understand what are the different ways a raster is projected in ArcGIS Pro. When you add a raster to the map in ArcGIS Pro, the spatial reference of the map becomes the same as the spatial reference of the raster. For example, if the first layer added has a NAD_1983_StatePlane_Vermont_FIPS_4400 PCS, the map will have the same spatial reference, and all other layers will project on the fly to match this spatial reference. This on-the-fly raster projection is meant for a richer display experience but does not preserve the raster structure (different cells can have on-the-fly-projected different sizes, rotations, and distortions). However, when you project a raster using the Project Raster tool or specifying the Output Coordinate System environment of a geoprocessing tool, the raster is actually projected into a new raster structure (every cell is an identical rectangle in the output spatial reference, with sides parallel to the coordinate system axes). When measuring geodesic distance for the comparison of the cell size projection methods, it is recommended to use the actual projected raster instead of the raster that is projected on the fly.
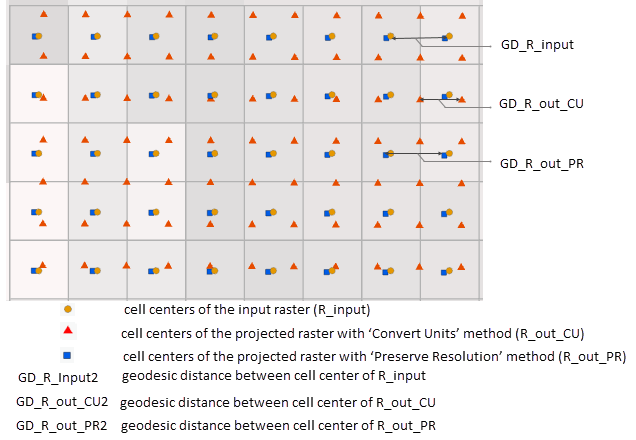
In figure 3, the cell size of the input raster, R_input is 30 meters. This is approximately the same as its geodesic ground distance, which you can find out using the Measure tool in ArcGIS Pro.

When the raster is projected using the ‘convert units’ methods, the projected cell size of the output raster, R_out_CU remains 30 meters, but 30m in WGS 1984 World Mercator is a much smaller distance on the ground, 21 meters. So, raster projection using the ‘convert units’ method has unnecessarily increased the resolution of the output raster. If we were projecting in the opposite direction (starting from WGS 1984 World Mercator), then we would have lost a significant amount of raster data. When the same raster is projected using the ‘preserve resolution’ method, its cell size becomes 42 meters and the geodesic ground distance remains 30 meters, which is the same as the geodesic distance of the input raster.
Example 2:
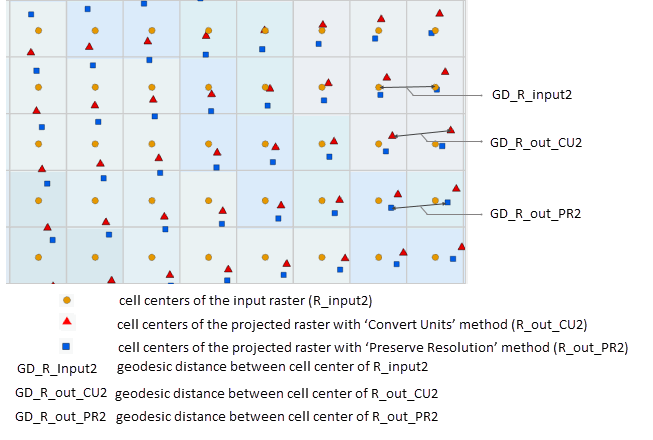
In this example, we will project from a UTM zone to its adjacent zone, which can happen when mosaicking together many different DEMs for a larger (state sized) area. In figure 4, let’s take a raster (R_input2) in WGS 1984 UTM Zone 11N and project it to its adjacent zone WGS 1984 UTM Zone 12N, creating output (R_out_CU2) and (R_out_PR2) for ‘convert units’ and ‘preserve resolution’ respectively. From here we will again compare the geodesic distance between the cell centers to determine which method preserve the geodesic distance more accurately.

The cell size for the input raster, R_input2 is 30 meters, which is approximately the same as the geodesic ground distance in this area. When the raster is projected using the ‘convert units’ method, the cell size of the output raster, R_out_CU2 becomes 30 meters and the geodesic ground distance becomes approximately 31 meters. When the same raster is projected using the ‘preserve resolution’ method, its cell size becomes 28.99 meters, and the geodesic ground distance is 30 meters, which is the same as the input raster.
In both the examples, the ‘preserve resolution’ method seems to preserve the geodesic ground distance between cell centers better than the ‘convert units’ method. Other combinations of input and output spatial references may, of course, show difference between the methods, but overall it is safe to say that the ‘preserve resolution’ Method is a better approach for preserving geodesic distance while projecting datasets.
An important property of the ‘preserve resolution’ method is that the output cell size depends on the location of the dataset. The same combination of input and output spatial reference will yield a different output cell size if the input raster dataset is at a different geographic location. If you need to use one cell size for different raster datasets (for example, processing adjacent DEM tiles), specify one raster dataset to use as the cell size source while performing raster analysis for the tiles.
Next time you use a Spatial Analyst geoprocessing tool or python command to:
- create an output with a spatial reference different from that of the input dataset,
- use input datasets with different spatial references,
- specify an analysis cell size using a dataset with a different spatial reference,
pay attention to the output cell size and consider using either the preserve resolution or center of extent methods. By default, the projection method will do the ‘convert units’, which existed in previous versions of ArcGIS, but as we have seen, this method may unnecessarily increase or decrease the resolution of your valuable raster data.

Commenting is not enabled for this article.