Note: This blog article covers the classic Esri Story Maps which are in mature support and scheduled to be retired in late 2025. Story authors are strongly encouraged to use the new ArcGIS StoryMaps to create stories.
For more information about transitioning to the new StoryMaps, see ArcGIS StoryMaps resources. For more information about the transition from classic Esri Story Maps to the new ArcGIS StoryMaps, see Esri Story Maps: Now in mature support.

PowerPoint is the standard when it comes to presentations. But if you have to switch back and forth between PowerPoint and live demos, media, or websites, it can be inconvenient and clumsy, not to mention visually jarring and disruptive for your audience. Switching out from PowerPoint typically means exiting PowerPoint, or using Alt+tab or Command+tab to switch back and forth between slides and other content you want to show.
While any Story Map can be used to deliver a presentation, some are better suited to the task than others. My preference is the Story Map Series, specifically the bulleted or tabbed layout, since those provide sequential access moving from left to right, and advance on a click, rather than a scroll (like Story Map Cascade). Map Series bulleted and tabbed layouts also do not require using a side panel for additional text or media—something not needed for most presentations.
Here’s some tips on using a Story Map Series instead of PowerPoint for your presentations. In this example the bulleted layout is used, but the tabbed layout works in a similar way.
Adding PowerPoint slides to a Story Map Series
Once exported, the easiest and best way to add the slide images to your Story Map Series is to add them from your local drives where you’ve exported them. When using this method, the images are automatically resized and optimized, and stored within your story map.
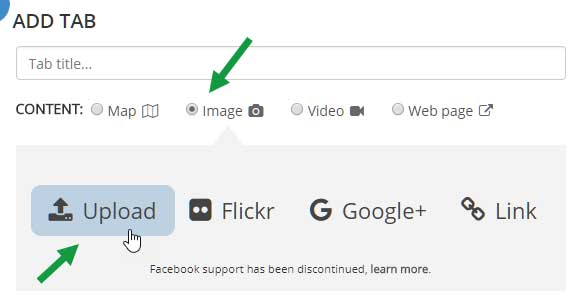
Add a locally stored slide image
To add a slide image to your story map from a local file, add a new tab or bullet, click Image, then Upload. Browse for the image, or drag and drop into the story.
This is the recommended approach, unless you plan to display your slides via an embedded web page, a more advanced option discussed at the end of this post.
As with any image, you can also host them on your own servers, in your ArcGIS account, and can use other online locations, such as Flickr, Google Photos, Box, and Google Docs. When using locations other than Flickr, ensure your images are resized and optimized for web use.
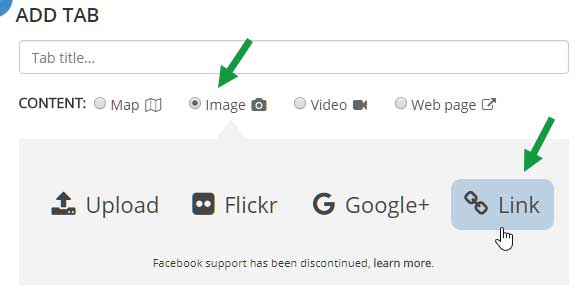
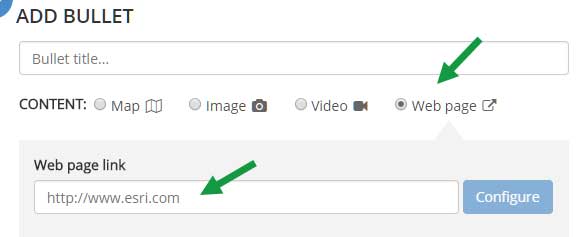
Add a slide image from a URL location
To add a slide image to your story map from a URL location, add a new tab or bullet, click Image, then Link. Paste the URL into the link input.
Positioning the image
After adding your slide image, use Fit, rather than the default option of Fill.
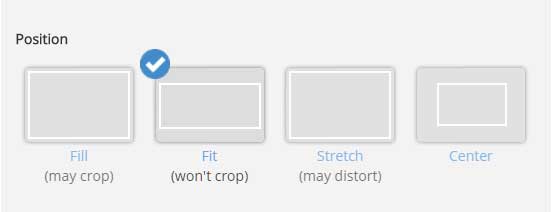
This provides the best results for slides with text; the entire slide will be displayed ensuring no text will be cropped. Fit also ensures slides will display well on any projection resolution or aspect ratio.
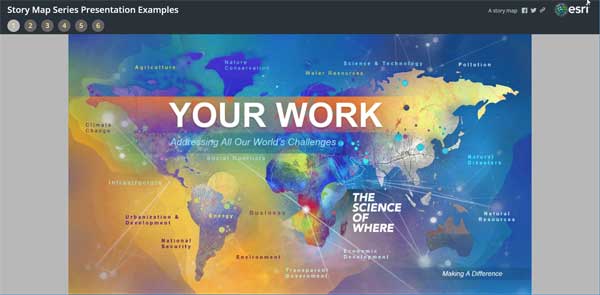
An Example
In this Story Map Series, a PowerPoint slide has been exported and added to the first entry. When adding slides, the text panel can be left blank—you won’t need it since your slides will include all the necessary text.
Consider the main stage background
The main stage of a Story Map Series has a background color. When using Fit the main stage background may be visible around the slide edges.
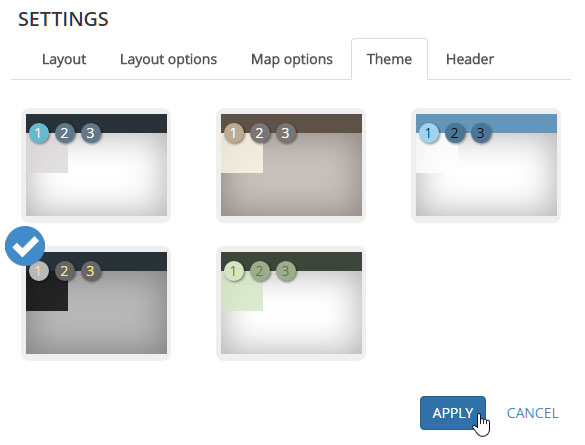
You can choose a different theme that will complement your slide backgound. Click Settings

Then click Theme, and choose a color scheme that works best with your slides. Click Apply when finished, and Save your story map.
Eliminating the background using Center
In some cases you may know the exact display resolution for your presentation in advance. If you do, another option is to determine the size needed to fill the main stage, add a few pixels on all sides to ensure the slide completely fills the space, then use a position of Center.
Note: This technique only works when you purpose-build a presentation for a specific event and know the exact display size, since when you use Center your slides can be cropped when displayed at different resolutions.
Eliminating the background using a web page
You can eliminate the background completely by using a web page to display your slide, then adding the web page to the main stage. This method requires you use a single color slide background and display the slide in a web page that sets the background color of the page to match the slide background. This is an effective technique for any display resolution or aspect ratio.
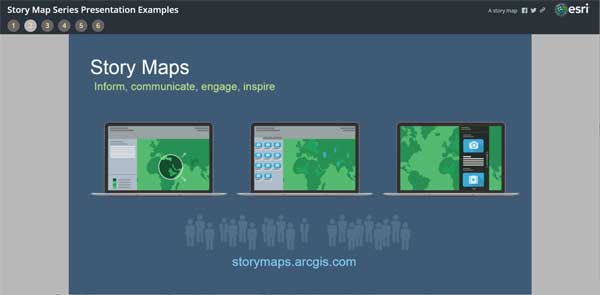
Below is a slide image inserted on the main stage using a Position of Fit, as described earlier. View example.
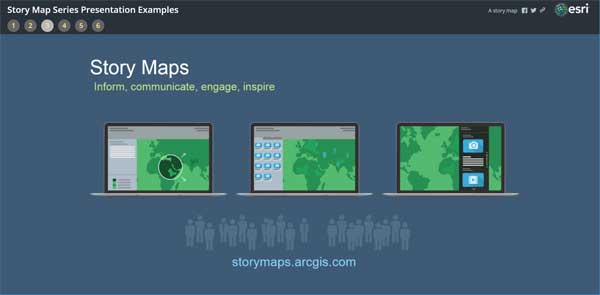
In the next example below, the slide has been added using a web page that sets the background color of the page to match the slide background color. View example.
Create the web page
Copy and paste the markup below into a new HTML document and make the necessary edits for the background color and slide URL. Host the HTML document, and add it to your story map as a web page, using the default Fill option. The HTML will display the slide responsively, so that it fits any size or aspect ratio. Remember that if your story map uses HTTPS, everything else must be HTTPS.
Adding maps, apps, and more
In addition to your slides, you may want to add web maps, apps, and more. When adding a web map for use during a presentation, you may want to add the map using the Map Viewer to enable interactive demonstration capabilities. You can also add scenes using the Scene Viewer. Add them as a Web page using the URL of the web map or app.
Use the default Fill position. Since the Map Viewer and most apps and app templates are responsive, they’ll fill the entire main stage area.
Tip: When embedding apps and other Story Maps you can minimize the user interface, which is recommended for best results. See Embedding a Story Map within a Story Map. Other apps and the Scene Viewer can also be minimized, see details in the examples and descriptions below.
Examples
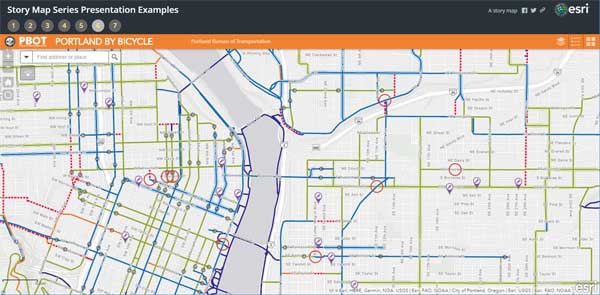
Open the Story Map Series Presentation Examples. Click the tabs at the top, or links below, to view the examples.
By embedding the Map Viewer using your organization URL, you have complete access to all of the Map Viewer capabilities.
When embedding the Scene Viewer, you can append &ui=min to the end of the Scene Viewer URL to minimize the interface. When you mouse over the scene, navigation UI elements will appear. Compare the options below:
Tab 6: Embedded Web AppBuilder app.
When using Web AppBuilder or other configurable apps, you can make UI elements invisible or otherwise remove them for a better experience when embedded.
Tab 7: Embedded Story Map Swipe & Spyglass
By appending &embed to the URL of any Story Map, you can minimize the UI for embedding it within your presentation.
Maximizing your presentation
When displaying your Story Map presentation in a browser, maximize the display area by appending &embed to the end of your story map URL. This eliminates the title (and subtitle if you have one), and only displays the bullets or tabs.
You can also hide all browser bookmarks to gain additional space, and can display the presentation in full screen mode (F11 in Chrome) to omit browser tabs and use all of the available space.
Tips and considerations
Story Maps are a powerful way to tell a story using maps and media, and Story Maps can be a powerful way to deliver presentations. Some thought and planning will provide the best results. Here’s a few things to consider.
It’s easy to author a terrible PowerPoint presentation, and we’ve all suffered through our share of them. Crafting a great Story Map is somewhat of an art, and a great Story Map presentation is no different.
Omit, or limit, the text in the Story Map so that the audience listens to you, instead of reading words.
Story Map presentations work best when they are short. Story Map Series supports a maximum of 30 tabs or bullets.
Story Maps do not offer the slide transitions and animations that are available in PowerPoint. If you feel these are necessary, stick with PowerPoint.
Choose the best Story Map for your purpose. Story Map Series, using either the tabbed or bulleted layouts with their optional text panel, is ideal if you want your audience to focus on your slides and live apps.
When adding content via a URL that takes a while to initialize (like a detailed web scene), ensure that Unload when reader navigates away is unchecked for your entries.
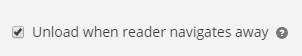
Before your presentation you can “warm up” all your maps and apps, and unchecking this option ensures they do not need to be reloaded when you reach that part of your presentation.

Commenting is not enabled for this article.