Picture this…mask mandates have been lifted, businesses have re-opened their doors, and face-to-face team meetings and collaborations have resumed in the office. This is what most of us started experiencing toward the end of 2021 as COVID-19 cases and deaths from the Delta variant began to decline and restrictions were eased by business organizations around the world. Despite the ongoing pandemic, normalcy was slowly returning. That is until August 4, 2022 when the White House declared monkeypox a public health emergency in the U.S. Now our brief sense of normalcy is starting to fade as the future seems unpredictable.
Declaring monkeypox a public health emergency opens avenues for different solutions – things such as grant funding, federal contracts for treatments and medical supplies, and support for emergency hospital services. But how do we ensure that we do not reach an emergency breaking point as we did at the height of the COVID-19 pandemic?
One thing we did learn during the COVID-19 pandemic, is that applying place-based solutions allows us to identify and support communities with the most need. Real-time data sharing, analysis, and visualization of the COVID-19 pandemic became a trend after John’s Hopkins University built their influential map-based COVID-19 dashboard, using Esri software. The world realized that to gain the situational awareness required to respond strategically and equitably we needed to visually see which communities were most impacted by the pandemic.
Monkeypox is no different, this public health emergency requires a multi-pronged response and that requires a modern system to keep track of all moving parts. Geographic information systems (GIS) transformed the way we responded to the COVID-19 pandemic and can similarly support efforts to contain monkeypox. Governments everywhere leveraged GIS technology during the pandemic and should put their knowledge and the technology to use for the current crisis.
We are at a pivotal moment where we can get ahead of this health emergency, but we must adopt a geographic approach in our response efforts. GIS can support response efforts in 3 major ways:
- Tracking positive cases to stay abreast of the developing outbreak
- Providing insights into which communities are being affected the most
- Distributing vaccines and treatments equitably
GIS Enters Our living Rooms
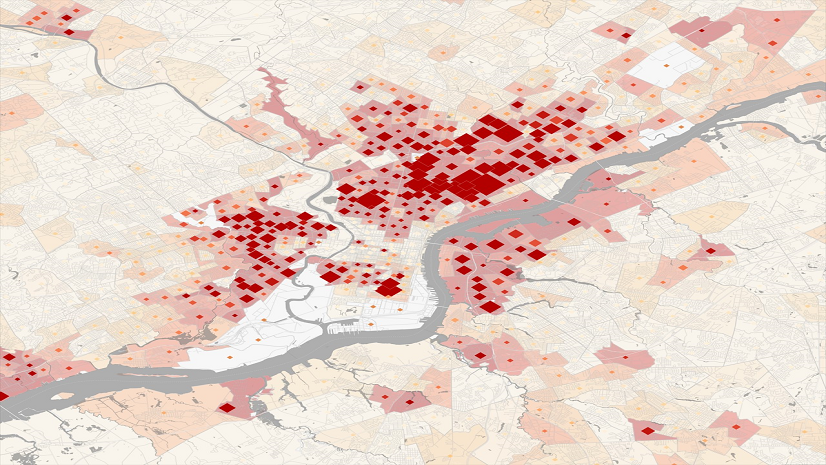
Every night during the pandemic people tuned in to their local news station to hear an update on the severity of COVID-19 cases and the extent of its spread. First the Johns Hopkins dashboard and then a plethora of look-alike dashboards dominated the screen. Reporters could easily navigate and filter the dashboards – they did not require GIS expertise. The dashboards were intuitive. The same effective and easy to use dashboard application has been applied to monkeypox tracking. This time, Esri Canada jumped in and launched a public dashboard which allows anyone to access the current data about monkeypox, not just those familiar with GIS technology.

The dashboard provides up to date counts of cases in each country. Data for smaller geographies is also available. Communities and governments everywhere benefit from this location intelligence to respond accordingly. Without real-time data, insight into which communities are being impacted the most by the disease is unattainable.
Prioritizing Communities with the Most Need
The monkeypox tracker not only offers real-time awareness about the number of cases in an area, but it also shows the communities in which cases were reported. This is essential as it will allow a more tailored response. GIS can provide insights into demographics, social vulnerability, and populations with the most risk of being infected or experiencing severe disease. This information helps you to identify local communities with the greatest need, the first step toward location-tailored responses with diagnostic services, education and awareness, and perhaps even an increase of healthcare workers. Identifying vulnerable communities is a necessary precursor to equitable access to care and services and this can be easily done with location-intelligence.
Equitable Vaccine Distribution
Access to care is especially important for preventative services. The World Health Organization has confirmed that the smallpox vaccine can be used as a measure to reduce the risk of human-to-human transmission. But experience from COVID-19 taught us that vaccine distribution needs to consider issues of equity if the program is to be effective. Milwaukee County taught us to leverage the EVE Model: Evaluating Vulnerability and Equity which uses location intelligence to overlay localized vulnerability metrics (communities most likely to be exposed and contract disease) with vaccination rates.
Seeing this visually allows governments to prioritize messaging and vaccine distribution to these vulnerable communities.


Keeping a Crisis at Bay with GIS
Applying a geographic approach to public health crises gives governments and communities deeper insight into how to strategically respond and keep their communities safe. Things like resource allocation, vaccine distribution, health equity, and advancing awareness can all be amplified with GIS. If we want to slow the spread and severity of monkeypox we must first apply place-based solutions.
Learn more on how to leverage location-intelligence to respond to public health crises.